We've experienced a 3% drop from the highs since February 18th. While the 3% drop isn't too significant it certainly feels different than trading has felt over the last year or so. The fundamentals continue to show a mixed to improving economy although the fuel that has propelled the economy over the last several months is schedule to be discontinued by June when QEII will be halted (perhaps).
Over the last month we've seen surging food and commodity prices that have been been the final straw that unleashed riots and discord throughout the middle east and emerging world. Oil pierced the $100 level and now we must keep in mind the impact that these high costs will have on the fragile economies of the world. Finally, the Japanese quake and unfolding disaster there will make the world economy more nervous than ever.
TOTAL RAILS – http://railfax.transmatch.com/
Rails continue to outpace last year's tonnage with the exception of a downturn in grains and food transportation.

RAILS – AUTOS
We have seen an increase in autos that have been shipped in the last week.
RAILS – SCRAP
Scrap shipping continues to be just on pace with last year.
CANADIAN PACIFIC –
CP has recently underperformed last year's shipping totals and that continues to be the case. In fact, CP's stock price too has been lagging relative to those other rails and has dropped more significantly compared to the likes of KSU or CSX.

SCRAP INDEX – http://www.scrap.net/cgi-bin/composite_prices.cgi?id=100000&num=5
The Scrap Composite Index showed its first drop since the second quarter of 2010. It does appear that there is a seasonal component to the drop if you look at the previous year-end, but it is worth watching.

HOME PRICES – http://www.realtor.org/research/research/ehsdata
NAR reported another drop in the average home price for the month of January to a shocking $206,700. The highs in July of 2010 were pegged at $231,700 which highlights the correction we've seen of $25,000! If you recall the months of June and July were the cutoff dates for the first-time home buyer tax incentives where buyers could get an extra $6,000 to $8,000 towards their home purchase courtesy of the US government (you and me). What a complete waste! We are now below the February 2010 lows. In other words if you were dumb enough to buy a home based on the home buyer credit, you are close to being underwater.
MOODY'S / MIT TRANSACTION INDEX (COMMERCIAL REAL ESTATE) – http://web.mit.edu/cre/research/credl/tbi.html
The Moody's MIT real transaction index dipped in December by almost 1 percent, although the entire 4th quarter was quite strong. In total, the rally is not impressive, yet you've got to keep hope alive and any rebound is great.

MONSTER JOB INDEX – http://about-monster.com/employment-index
The Monster.com Job Index rose to a level of 129 in the month of February which is a 7 percent increase over the previous month. The year over year growth is only 4%, but is positive. The rebound is needed as it halted a 4 month slide. The number of listings are well below the September 2010 levels.

FOOD STAMPS (SNAP DATA) – http://www.fns.usda.gov/pd/34SNAPmonthly.htm
December's SNAP (Foodstamps) data release shows up that there is no let up in the amount of Americans that are taking the government up on available programs to feed the poor. December showed a 1.12% increase over the previous month and now indicates that there were more than 44.1 million people accepting assistance which is a 13.1% increase from the beginning of 2010. Back in October of 2010 we saw a slowing in the rate of folks on the food stamp roles, however December marks the second straight month of an increasing rate of usage (the rate of change is increasing). Obviously this information is dated and hopefully the numbers out of the Monster Employment Index can arrest these startling figures. My heart is breaking for these people. If you have any desire to see what is happening right here on US soil to your nation's children, please see the post we completed earlier this week – POVERTY IN THE USA – WHAT NO ONE WANTS TO SEE.

CFO OPTIMISM SURVEY – http://www.cfosurvey.org/11q2/PressRelease.pdf
The Duke / CFO Magazine CFO Survey was released last week and it shows that the bean counters in American businesses are more optimistic than last quarter about the economy. They also suggest that capital spending will increase, and they predict that dividend distributions will actually be much higher. There were a couple of reasons to pause though as they stated that they don't see much improvement in the job outlook and that any evidence of inflation could damage their outlook. Hum. It seems like this is more of the same here. Company makes more money, company does not hire more employees. One other note, the firms CFOs stated that credit conditions were improving, except for smaller firms.

UCLA FUEL INDEX SURVEY – http://www.ceridianindex.com/
Growth in fuel usage has been slowing since January in this index. This indicator usually follows movements in the overall indices and therefore I do not use it as a predictive tool, but more of a confirmation of overall economic activity.

COPPOCK TURN INDICATOR
The Coppock Turn Indicator has stubbornly held its negative outlook since it flashed a sell signal all the way back in June of 2010. If the Dow can move higher than 12125 to close for the month of March it will actually flip to bullish. As I often comment, I think we've seen that the Coppock is pretty unreliable, but I am keeping it updated for entertainment purposes only. Perhaps we'll see the Dow at 10500 again soon, but clearly the indicator missed out on a 2000 point ride north since then.

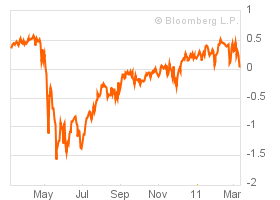
US FINANCIAL CONDITIONS INDEX – http://www.bloomberg.com/apps/quote?ticker=BFCIUS:IND
As we have seen over the last several months, whenever the US Financial Conditions Index eclipses the 0.0 mark it stalls out. The zero level indicates that the economy is expanding, thus leaving recession behind. Each time we've seen the FCI hit the 0.5 level it is slammed back and these last several weeks have been no exception. I perceive this as a warning sign that the economy is still not out of the woods, although perhaps another $600 Billion of QE III might get us up to 1.0 at least, don't you think? As of Friday the index was back at 0.148.
BALTIC DRY GOODS INDEX – http://www.bloomberg.com/apps/quote?ticker=BDIY:IND
The Baltic Dry Goods Index did see a reversal over the last month and has rebounded strongly. I am guessing that part of the rebound has been directly related to stockpiling of dry goods such as grains as a result of the unrest in the Middle East. The timing looks pretty good as an explanation for the significant move up in spot rates.

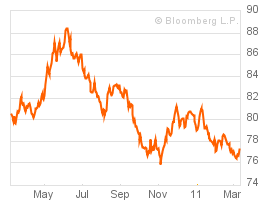
US DOLLAR – http://www.bloomberg.com/apps/quote?ticker=DXY:IND
Is that a tick up I see? Strange. While it is odd to see the dollar move up, I would suggest that this actually could be something we might see continue for a week or two more as this correction in equity markets develops. We did see the dollar fall on Friday. The dollar is at a critical place here where it needs to find support. If not, we could easily see it usher in a new blast lower to areas not previously seen. The push lower would cause renewed spikes in precious metals and other commodities like copper and oil.
6 MONTH LIBOR - http://www.homefinance.nl/english/international-interest-rates/euribor-rates-6-months.asp
As we noted earlier last week, 6 Month Libor continues to move higher. There have been rumors of interest rate hikes in Europe, as a move to stave off inflation, but the weakness in the banking system there simply makes me think that it cannot be done. We are seeing lots of talk, but little real action.

TRADING UPDATE
In favor of getting this post up for the beginning of the week I am going to cut things a bit short and make every effort to post over the next couple of days a deeper look at specific areas where trading is at a critical juncture. Overall, markets for the last couple of weeks seem to be consolidating and trying to churn through some new selling. The selling hasn't been overwhelming, but heck, it is new to actually see selling! Remember, in our 2011 Forecast we identified March as a critical month due to the idea that big players would not wait to exit markets as QEII terminated. In other words, big funds and hedgies weren't going to wait for June to roll around before exiting positions. If the FED quits buying treasuries then that means that they quit exchanging those treasuries for dollars which somehow find their way into other speculative assets (food and other commodities anyone?). It would not be too hard to believe that we may see a decline in the thrust upward in many of these very frothy "investments" if the fund managers and primary dealers suddenly think that they may lose their source of fuel.
I don't want to get too over zealous though because markets are still weak enough that all it would take to see a huge snap back rally higher is an announcement from Fed officials that weakness is too great to stop these open market actions and QEII will actually be extended with a new batch of electronic cash. I also think that the Japanese disaster is just about enough of an excuse to put all free-market exercises on hold for another 6 months. There will always be a reason to extend an pretend as long as you have a printing press at your fingertips!
Overall, as I mentioned at the top of the post, information is mixed to improving. The overall job picture is getting better, but that doesn't mean that incomes are up. The CFO survey indicates that there are areas where there will be job growth, but as they see it, jobs won't be the big winner in the next quarter. Housing just can't get better and the decline in home prices are really troubling.
I will leave you with this last nugget that I put together with Robert Schiller's Irrational Exuberance data at http://www.irrationalexuberance.com/ . What I'm highlighting here is that we are at P/E levels that have been experienced around 6 other periods in the last 90 years. In each instance, stock markets corrected pretty significantly after those levels were reached. Now this is not to say that the correction is immediate (for goodness sakes, look at the 2000's!), but it is sort of like the treasury trade where we know that we are at historic lows and it is a pretty good bet that we'll see higher rates in the future. In the same manner, we know that we are at high P/E's and there is a safe bet somewhere and at some time that suggests that they will go lower and so will the markets. This is just one more warning that should be going off in our minds that there is risk in this system and we need to be fully aware that things could break down. The obvious question is simply when.
Please stop by the blog over the next week to see the update trading commentary on specific areas including emerging markets and a more detailed review of my gasoline trade. As markets open we should see Japan drop significantly with a carry through of the decline to as much as 10% in coming weeks. There will probably be a rebound due to printing of liquidity. One quick note on oil and other energy fuels, we should also see a drop in oil as there will be a drop in economic activity in Japan and Asia as a result of the disaster. I see this as temporary as the unrest in the Middle East is not going away and I continue to watch for the Saudis to demonstrate and attempt to overthrow their leadership. If any momentum is built in that country, oil and gas will rocket higher.
www.goatmug.blogspot.com
GOATMUG