Slope of Hope Blog Posts
Slope initially began as a blog, so this is where most of the website’s content resides. Here we have tens of thousands of posts dating back over a decade. These are listed in reverse chronological order. Click on any category icon below to see posts tagged with that particular subject, or click on a word in the category cloud on the right side of the screen for more specific choices.
My One Long for Hedging
By the time you read this, I may be stopped out of it already, but……….I am going long the miners via GDX with a stop at 53.60 – I think this trade is good to 57.50 before it rolls over.
Muddy Waters (by Springheel Jack)
After several days of being divergently strong, NQ broke down hard yesterday and was divergently weak. The decline has formed a very steep declining channel in the short term and if that breaks up I'll be expecting a decent bounce:

I didn't post a TF chart yesterday as there wasn't much to see in trendline terms. That changed with yesterday's low, which has delivered a decent support trendline. A falling wedge may be forming in which case I'd expect a bounce to test the declining resistance trendline in the 850 area. Below that broken support may act as resistance in the 833 area. TF is showing positive divergence on the hourly RSI:
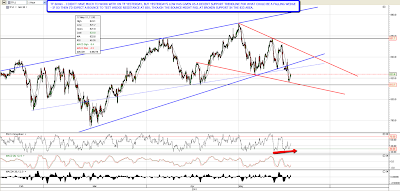
Like TF, ES is also showing positive divergence on the hourly RSI. On the ES 15min chart I have a falling wedge within what might be a declining channel:

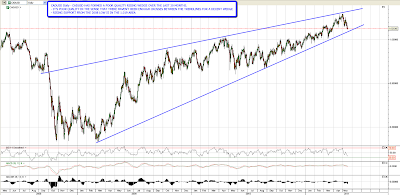
Copper's getting close to a hit of the upper trendline of the declining channel I've drawn for it. That hit will be below strong resistance at 408.5 and one or the other should hold today:

Most of the major USD currency pairs have broken support in recent days, though they're generally a long way above multi-year rising support. There hasn't been as clear a break on CADUSD, but rising support from late 2008 is fairly close below at 1.019. CAD has formed what looks to the casual eye like a rising wedge over the intervening period, but it isn't one really as there haven't been enough crosses between the trendlines. Nonetheless the obvious target for this move on CADUSD is that lower trendline and it might hold:
I posted the broadening ascending wedge on gold last week and said that the short side on gold and silver wouldn't get really interesting again until the wedge support trendline was broken. It's still holding:

At the same time silver is showing some signs of breaking up. I capped this silver chart at the same time as I did the gold chart and since then silver has broken it slightly and opened the next candle above it. It has since pulled back, and it isn't therefore a break with any confidence so far, but it is telling us that the next significant move for silver may well be up:

I must confess that I'm struggling a bit to take the current equities decline seriously, and that's because the timing's all wrong. I expected this move to start sometime between late June and early August to coincide with the end of QE1, and from a higher level so that a move to SPX main bull market support in the 1230-50 area would be a very sharp decline and possibly spook the Fed into announcing QE3. Potential downside from here isn't much below 1250 still, and I'd expect it to end before the end of QE2 and start recovering. I haven't seen anything that suggests to me that this bull market is close to an end and I'm still considering the possibility that we're just in a big and choppy range while commodities correct and USD bounces. Either way there's more correction or chop coming.
