'We simply attempt to be fearful when others are greedy, and to be greedy only when others are fearful' – Warren Buffett
This is a very famous investing quote from Warren Buffett, and the gist is that you tend to get the best buying opportunities after a sharp fall, and the best selling opportunities after a sharp rise. This isn't a rule to be followed blindly of course, but my bullish friend Pug posted a chart yesterday that illustrated this very well and it is the chart of breaks below the SPX daily bollinger bands. I've extended this chart back into 2007 to show that these breaks down, in both bear and bull markets, tend to be a very strong buy signal, with the day of the break frequently marking the short term low. Here it is:

In the short term support held on my ES falling wedge, though it overshot by half a point on the strict thinnest pencil reading. As long as that support holds then the highest probability direction is up to wedge resistance that is currently at 1339.5. Given that the SPX BB chart shows that these breaks down out of the daily BBs are usually followed shortly afterwards by strong rallies, and that falling wedges break up 70% of the time, it would be folly to write off the long side here in my view:
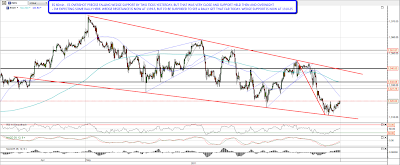
That's not to say that no technical damage has been done by this latest decline though. I said last week that a close below last week's low would cause some technical damage, and I was thinking of the channel support trendline from the Summer 2010 lows on SPX. There was a pinocchio down through that trendline yesterday, though SPX recovered above it by the close. A close below it would be a very dangerous sign of weakness:
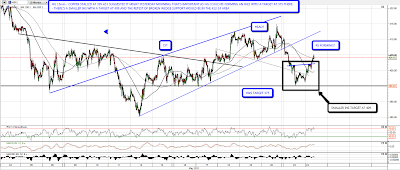
NQ blew through my support trendline for my possible broadening ascending wedge yesterday, so that pattern is trashed. It hasn't broken down of course, as the lower trendline needed a third touch to confirm it in any case. I'm just left with a strong resistance trendline on NQ & I'll have to give that some thought. The picture looks clearer on NDX, where the neckline of the sloping IHS there held at the lows, more or less, while NDX filled the open gap zone that has been acting as support. The SPX open gap in the 1313-1219 area was filled at the same time. Again with NDX, as long as that neckline holds, the default position looks bullish here:
I'm spoilt for choice with charts this morning, so I've bumped the TF chart, which held the support area I indicated yesterday and is still therefore possibly forming a large H&S with a possible RS target in the 845-860 area. You can look at yesterday's TF chart here if you want to refresh your memory of that setup. Copper has formed a little IHS overnight with a target at 409 and that has broken up. The picture is more complex than that though as copper bounced at the 395 support area I highlighted yesterday morning, and may therefore be forming a larger H&S with an RS upside target in the 404-5 area. So far copper has reversed at 405 so that is still very much in play. If 405 breaks then upside targets are 409 and a possible broken wedge support target in the 412-4 area. A break back into that wedge would be very bullish:
On oil a nice little triangle has formed as it has bounced around for the last few days. Support is at 96.75 today and resistance is at 100 with an upside touch more likely next:

Silver has broken up nicely from the little triangle I've been posting in recent days. It isn't a good quality triangle, as the lower trendline needed a third touch to confirm it, but more upside looks likely from here, and for what it's worth, I'd put the triangle target in the 38 area:

USD/DX hasn't reached the key declining resistance trendline I posted yesterday, and I thought I'd post the GBPUSD chart today to show that it has reached a very key support trendline overnight and bounced there so far. This is the key bull/bear line on GBPUSD in my view and if it breaks down then the obvious target would be the strong support (and possible H&S neckline) at 1.534. This doesn't matter as much for USD as EURUSD, but while USD might make it to declining resistance without GBPUSD breaking this main support, if it is to rise further then that trendline on GBPUSD would really have to be broken. GBPUSD is also in a small declining channel with resistance in the 1.625 area and I'll be watching that for a break up. One to watch:

I'm leaning towards a bounce today, and on the bigger picture I'm sticking with the bullish scenario until that falling wedge on ES breaks down. This isn't a conviction position, as I don't think convictions fit well with technical analysis, where the charts should lead and the analyst should follow. The charts are still telling me that the highest probability trade is up, so as long as that's the case that's good enough for me.
