Brian Johnson here with another after market video wrap up. Some very nice entries were given to us today on the long side and it sure appears that we are in a wave 3 of something. The 50 day moving averages went down without much problem and the bulls had no trouble holding them into the close. The month is over so let’s see if they decide to hold those moving averages into the last day of trading. Remember, this is a three day weekend so make sure you decide what to do with your positions going into the 4th!
Slope of Hope Blog Posts
Slope initially began as a blog, so this is where most of the website’s content resides. Here we have tens of thousands of posts dating back over a decade. These are listed in reverse chronological order. Click on any category icon below to see posts tagged with that particular subject, or click on a word in the category cloud on the right side of the screen for more specific choices.
Hedging Update — ETFs
The Chicago Board Options Exchange Market Volatility Index (VIX) dropped 9.91% Wednesday, to close at 17.27. The table below shows the costs, as of Wednesday's close, of hedging 18 of the 20 most actively-traded ETFs against greater-than-20% declines over the next several months, using the optimal puts for that. First, a reminder about why I've used 20% as a decline threshold, what optimal puts mean in this context, and a quick note about why there were no optimal puts for 2 of these ETFs.
Optimal Puts
Optimal puts are the ones that will give you the level of protection you want at the lowest possible cost. As University of Maine finance professor Dr. Robert Strong, CFA has noted, picking the most economical puts can be a complicated task. With Portfolio Armor (available on the web, and as an Apple iOS app), you just enter the symbol of the stock or ETF you're looking to hedge, the number of shares you own, and the maximum decline you're willing to risk (your threshold). Then the app uses an algorithm developed by a finance academic to sort through and analyze all of the available puts for your position, scanning for the optimal ones.
Decline Thresholds
You can enter any percentage you like for a threshold when using Portfolio Armor (the higher the percentage though, the greater the chance you will find optimal puts for your position). The idea for a 20% threshold comes, as I've mentioned before, from a comment fund manager John Hussman made in a market commentary in October 2008:
An intolerable loss, in my view, is one that requires a heroic recovery simply to break even … a short-term loss of 20%, particularly after the market has become severely depressed, should not be at all intolerable to long-term investors because such losses are generally reversed in the first few months of an advance (or even a powerful bear market rally).
Essentially, 20% is a large enough threshold that it reduces the cost of hedging but not so large that it precludes a recovery. When hedging, cost is always a concern, which is where optimal puts come in.
How Costs Are Calculated
To be conservative, Portfolio Armor calculated the costs below based on the ask prices of the optimal put options. In practice, though, an investor may be able to buy some of these put options for less (i.e., at a price between the bid and the ask).
Why There Were No Optimal Puts for VXX and TZA
In some cases, the cost of protection may be greater than the loss you are looking to hedge against. That was the case with iPath S&P 500 VIX Short-Term (VXX) and the Direxion Daily Small Cap Bear 3X (TZA). As of Wednesday's close, the cost of protecting against greater-than-20% declines in those stocks over the next several months was itself greater than 20%. Because of that, Portfolio Armor indicated that no optimal contracts were found for them.
Hedging costs as of Wednesday
The data in the table below is as of Wednesday's close. The ETFs are listed in order of trading volume Wednesday, with the most actively-traded name (SPY) at the top.
|
Symbol |
Name |
Cost of Protection (as % of position value) |
|
SPY |
SPDR S&P 500 |
1.17%* |
| XLF | Financial Select Sector SPDR | 2.16%* |
| IWM | iShares Russell 2000 Index | 2.23%* |
| QQQ | PowerShares QQQ | 1.35%* |
| EEM | iShares MSCI Emerging Markets | 2.42%* |
| EWJ | iShares MSCI Japan | 1.74%* |
| VXX | iPath S&P 500 VIX Short-Term | No optimal puts at this threshold |
| EFA | iShares MSCI EAFE Index | 2.18%* |
| FAS | Direxion Daily Financial Bull 3X | 16.3%** |
| SLV | iShares Silver Trust | 5.23%** |
| SDS | ProShares UltraShort S&P 500 | 2.95%* |
| VWO | Vanguard Emerging Markets | 2.91%* |
| TZA | Direxion Daily Small Cap Bear 3x | No optimal puts at this threshold |
| XLE | Select Sector SPDR — Energy | 1.97%* |
| FXI | iShares FTSE China 25 Index | 2.17%** |
| XLI | Industrial Select Sector SPDR | 1.66%* |
| USO | United States Oil | 3.25%** |
| SSO | ProShares Ultra S&P 500 | 7.51%* |
| SMH | Semiconductor HOLDRs | 4.22%** |
| XLB | Materials Select Sector SPDR | 2.06%* |
*Based on optimal puts expiring in December, 2011.
**Based on optimal puts expiring in January, 2012.
Stocks To Watch – GME MEAS MORN
It's Brian Johnson with some stocks to keep your eye on as we progress into the end of this week and the start of July. I wish I could claim credit for finding these but alas it seems one of my students is to be given the credit for digging these up. Please excuse me if these are from some other source but heck…..they're REALLY nice setups!
GME is showing a really schweet head and shoulders play here. Target on this is down around the $22.50ish range which should coincide with the 200 day moving average.
I think MEAS is a good long over $35 and back to the $36 mark for the gap fill.
MORN Has tried multiple times to break that $61 area and it may get turned back again but if we could just get up and over that 61 number I'd be tempted to try this long back into the 64ish area.
SPY Update … (by Leaf_West)
Best 3-day move in a while … this type of thrust tells me that we are in a Wave 3 move. Next to come is a 4th wave pull-back and then a final wave 5 push to most likely new highs for this move.
I believe that we are at or near the end of wave 3 … what makes me think that is the slightly different pull-back that we experienced yesterday afternoon. The pull-back was the strongest we have seen since the move started Monday morning. A wave 4 pull-back should go at least to the 25% retracement area and most likely the 38.2% / 50% areas.
I will be looking to be flat in my trading accounts this morning after pruning some smallish overnight positions. If the set-up is good I will try and short the wave 4 move, but if not I will be patient and wait for the end of wave 4, to play the final wave 5 push. Don't kid yourselves, the easiest most profitable part of this move is over (wave 3).
Cheers … Leaf_West
Three White Soldiers (by Springheel Jack)
The very strong advance so far this week has delivered a three white soldiers candlestick pattern, which should indicate further upside to come. I'm expecting this move to be into the SPX 1340 – 50 area to make the right shoulder on the large H&S pattern that is forming, but it could be the start of a new bull wave up. Hopefully we'll see a helpful shorter-term pattern develop to indicate which way this will go. As we stand now SPX has reached the top of the daily bollinger bands and I'm expecting to see consolidation or a modest reversal here, subject to the greek vote two hours before the open today:

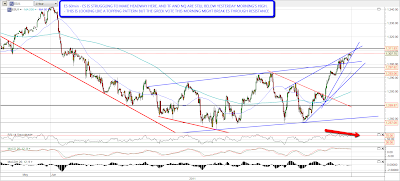
On the 60min charts ES has kept on going after breaking 1300 yesterday, though it is trapped between two trendlines that would suggest an absolute maximum upside of 1309 before ES breaks up or down. I've marked in the significant resistance level at 1311.50:
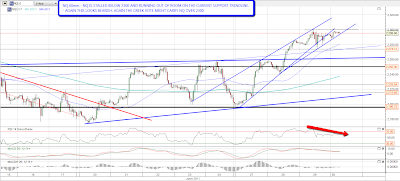
Since yesterday morning's pre-market high NQ has been stalled below 2300. NQ and TF have been underperforming ES since then which suggests reversal or consolidation here. There is a nice short-term support trendline on NQ that is now at 2297, so very shortly NQ will either break that support trendline or break through 2300. If it breaks up then my next upside target on the resistance trendline would be in the 2325 area:
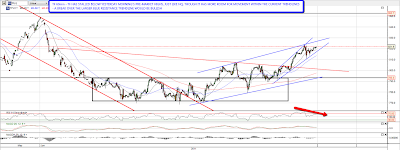
TF has also stalled below yesterday morning's pre-market highs. There's more elbow room within the TF trendlines however and my next upside trendline targets are currently in the 827 and 835 areas. Trendline support is at 817:
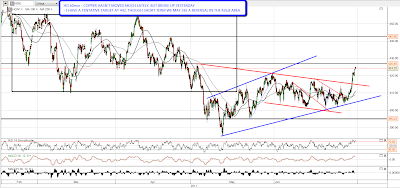
Oil is within the 94-6 resistance zone I mentioned yesterday and silver has now reached the broken support trendline and is stalled there. I haven't posted the copper chart much lately and that's because it hasn't been doing much. but after still not doing much while SPX moved up hard until the open yesterday, it has since broken up hard. It's looking short term overbought with some negative divergence on the 60min RSI, so I'm looking for some reversal / consolidation here. After that I have a tentative trendline target in the 440s:
EURUSD may be the big story of the day today with the greek vote, and it is now close to declining resistance in the 1.4535 area. I'm expecting a reversal there, though we may not get one of course. If it breaks up I'd be expecting a move to the 1.47 area and there's resistance there on EUR and also significant support in that area on DX. DX has now made the rising wedge target I have been watching this week:

As I said before, I'm looking for some reversal or consolidation at this level but this is a news-heavy close to the week and I may not get it. I'm watching the short term ES trendlines and resistance at 1311.50 for direction.
