Slope of Hope Blog Posts

Slope initially began as a blog, so this is where most of the website’s content resides. Here we have tens of thousands of posts dating back over a decade. These are listed in reverse chronological order. Click on any category icon below to see posts tagged with that particular subject, or click on a word in the category cloud on the right side of the screen for more specific choices.

Market Video for 062811

By -

It's Brian Johnson again and here's a video on the current state of the markets and what to look for as we move forward. We need to be watching the bear flags that are forming here but they're not confirmed until we break out of them to the downside. If we break up and out of them it could signal some kind of larger move upwards but that still needs to be shown over the next few days. There are some good entries still available for the bulls out there but it's important to wait for the levels to be broken before you enter.

Greek Tick-Tock

By -

Well,the week's pretty rotten for the bears so far. I guess the market has taken it as a given that the Greek parliament is going to approve their austerity measures, thus weakening the dollar and strengthening equities. It'll be interesting to see if this is yet another instance of "buy the rumor, sell the news" once the official vote is over.

Looking at the NASDAQ Composite, you can see some interesting parallels between the left side of this chart (which is the summer of 2007) and the right side (which is now). You can see a strong push higher, followed by a significant dip, another surge to a higher high, and another dip, followed by some more strength (but not enough to make a new high). It's worth watching to see if this pattern continues to hold, since we know what happened last time.

Picture 1

Looking closer, this time at the NASDAQ 100, you can see we are just about at the midline of the huge range that's been confining the market for many months. We were at the lows of this range not even two weeks ago, and I guess the bulls are counting on at least a recurring trip to the upper end of the range. My only caveat is that there's a fair amount of overhead supply at these levels.

Picture 2

Looking at the intraday chart of the Russell 2000 is the main thing keeping me from getting overly aggressive owning stocks. There is a very well-formed head and shoulders pattern, and we have retraced just about to the neckline. I won't be shocked if this neckline is badly violated, thus damaging the pattern, but it is worth watching in the meantime. These days, it seems the only assured things are that LULU goes up every day and GS goes down!

Picture 3

I confess I miss my normal daily "routine", since being on vacation definitely makes it much harder to keep the blog in its usual shipshape state. I'll try to stop apologizing about it, but I doubt it'll happen. I just have to keep plugging along!

Continued good luck to all of you, and hang on to your hats while this Greek situation finally moves along.

US Dollar Retracement (by Springheel Jack)

By -

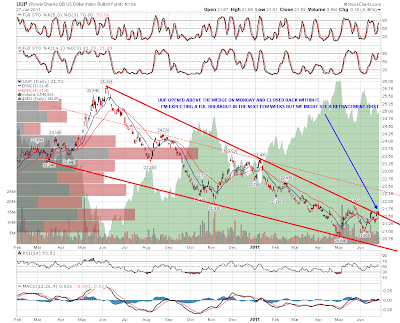
Tim Knight was saying the other day that trading equities was all about the US Dollar at the moment. There's a lot of truth in that while the spectre of a large scale sovereign debt crisis haunts the markets, so let's consider where USD is likely to go from here. At centre stage is the year old falling wedge on UUP, the dollar bullish ETF, and looking at that it seems likely that USD has bottomed for the year, as the wedge is now fully formed and making exploratory breaks of the resistance trendline:

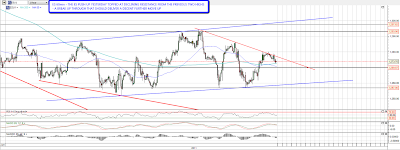
Short term though EURUSD is bouncing. The small falling wedge I posted on EURUSD yesterday broke up and made the 1.43 target I gave, but there may well be more upside coming looking at the DX chart, where a larger rising wedge broke down yesterday and has not yet reached the target just below 75. If that plays out to target or below then it might well help equities to make an impressive break up over the next few weeks:

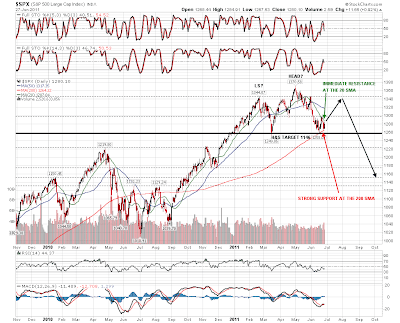
Why's that important? Well I still have my eye on the large H&S patterns that may be forming on SPX, NDX and RUT. To form the right shoulder on SPX we'd need to see a move to at least the 1310-20 area and lasting most likely into the end of July. If the H&S forms that doesn't necessarily mean it will play out of course. As with the large H&S last year we might then see a bottom near or slightly below the neckline. I've added some moving averages to this chart showing that the daily 200 SMA is currently support and the daily 20 SMA (the mid point of the daily bollinger bands) is currently resistance:

Short term the 60min futures charts for ES, NQ and TF all reached interesting levels yesterday. On ES the rise topped at declining resistance from the previous two highs, though there were three pinocchios through the trendline overnight which suggests that it will break soon. Resistance there is currently at 1276.75:

NQ was the strongest of the three indices yesterday, and topped out at a very interesting level, which is an alternate slightly upsloping neckline for an IHS which is less pretty than last week's IHS. It still looks valid enough though and the target on a break up would be 2340, which would be in my target zone for the large H&S building on NDX:

TF topped out yesterday at the declining resistance level I gave yesterday morning, though as with ES there were some pinocchios through that suggest that the trendline will break soon. On a break up I'll be looking for the rectangle target at 814.1 to be made, though the upper trendline of the rectangle has been violated repeatedly in recent days which weakens it somewhat:

We might see some retracement today and I'm watching my declining resistance levels to see whether they can be broken. A break up through those levels would be bullish, though I'm not really expecting a decisive move up before the Greek vote on Thursday, which could well give EURUSD a strong boost for a few days.