Slope of Hope Blog Posts

Slope initially began as a blog, so this is where most of the website’s content resides. Here we have tens of thousands of posts dating back over a decade. These are listed in reverse chronological order. Click on any category icon below to see posts tagged with that particular subject, or click on a word in the category cloud on the right side of the screen for more specific choices.

Hedging Update — Stocks

By -

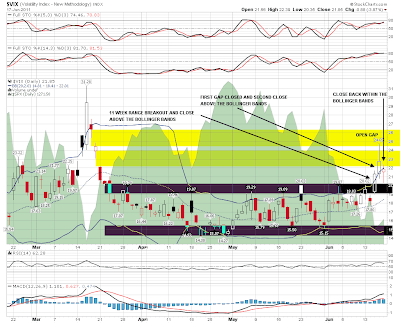
On Bloomberg TV Monday afternoon, markets reporter Adam Johnson noted that put protection had gotten more expensive since a week ago. That has been the case, as the the Chicago Board Options Exchange Market Volatility Index (VIX) has been above 20 since late last week. You can see examples of put protection getting more expensive in the table below, shows the costs, as of Monday afternoon, of hedging 20 of the most actively-traded stocks against greater-than-20% declines over the next several months, using the optimal puts for that.

Comparisons

For comparison purposes, I've also added the costs of hedging the SPDR S&P 500 Trust ETF (SPY), the SPDR Dow Jones Industrial Average ETF (DIA) and the Nasdaq 100-tracking ETF PowerShares QQQ Trust ETF (QQQ) against the similar declines. First, a reminder about what optimal puts mean in this context and why I've used 20% as a decline threshold.

Optimal Puts

Optimal puts are the ones that will give you the level of protection you want at the lowest possible cost. As University of Maine finance professor Dr. Robert Strong, CFA has noted, picking the most economical puts can be a complicated task. With Portfolio Armor (available on the web and as an Apple iOS app), you just enter the symbol of the stock or ETF you're looking to hedge, the number of shares you own and the maximum decline you're willing to risk (your threshold). Then the app uses an algorithm developed by a finance academic to sort through and analyze all of the available puts for your position, scanning for the optimal ones.

Decline Thresholds

You can enter any percentage you like for a threshold when using Portfolio Armor (the higher the percentage though, the greater the chance you will find optimal puts for your position). The idea for a 20% threshold comes, as I've mentioned before, from a comment fund manager John Hussman made in a market commentary in October 2008:

An intolerable loss, in my view, is one that requires a heroic recovery simply to break even … a short-term loss of 20%, particularly after the market has become severely depressed, should not be at all intolerable to long-term investors because such losses are generally reversed in the first few months of an advance (or even a powerful bear market rally).

Essentially, 20% is a large enough threshold that it reduces the cost of hedging but not so large that it precludes a recovery. When hedging, cost is always a concern, which is where optimal puts come in.

How Costs Are Calculated

To be conservative, Portfolio Armor calculated the costs below based on the ask prices of the optimal put options. In practice, though, an investor may be able to buy some of these put options for less (i.e., at a price between the bid and the ask).

Hedging Costs as of Intraday Monday

The data in the table below is as of Monday afternoon.

Symbol

Name

Cost of Protection (as % of position value)

SPY

SPDR S&P 500

1.49%*

DIA SPDR Dow Jones Industrial Avg 1.26%*
QQQ PowerShares QQQ Trust 1.90%**
NYSE Stocks
BAC Bank of America Corporation 8.18%**
F Ford 3.77%*
AMD Advanced Micro Devices, Inc. 19.4%**
GE General Electric Company 3.19%*
WFC Wells Fargo & Co. 6.03%**
NOK Nokia Corporation 16.3%**
C Citigroup Inc. 4.47%*
PFE Pfizer Inc. 2.37%*
S Sprint Nextel Corporation 11.2%**
ALU Alcatel-Lucent 11.5%*
Nasdaq Stocks
RIMM Research in Motion, Ltd 12.7%*
CSCO Cisco Systems, Inc. 6.01%**
MSFT Microsoft Corporation 3.14%**
LVLT Level 3 Communications, Inc. 11.6%*
INTC Intel Corporation 4.74%**
YHOO Yahoo! Inc. 8.34%**
MU Micron Technology Inc. 12.6%**
AAPL Apple, Inc. 3.90%**
ORCL Oracle Corporation 3.35%*
NVDA NVIDIA Corporation 8.56%*

*Based on optimal puts expiring in December, 2011.

**Based on optimal puts expiring in January, 2012.

We Need a Bounce. Right Now.

By -

I have, in my portfolio, done a couple of things:

(a) lightened up considerably, so that I've over half in cash right now;

(b) acquired several large long positions, and a handful of small long positions, in anticipation of a 4% to 6% bounce (depending on the index)

I usually hate the term "oversold", but having looked at a lot of individual stock charts, we really, really need a bounce right now. It doesn't have to push us to new highs; but a hearty bounce of about 5% (again, depending on the index) would make a long list of individual stocks deliciously attractive.

Here's roughly what I see in the next few weeks on some big indexes:

0620-COMPQ


0620-INDU

0620-MSH

0620-RUT

I profited from the May/June tumble in equities, but not nearly to the extent that I would have hoped. Should we get the kind of robust push higher that I'm anticipating, I intend to get very aggressive on the short side for what I feel could be the best bearish opportunity in 2011.

Cast Away (by Springheel Jack)

By -

I'm late with my Slope post today as I went to the hospital this morning to upgrade to my full cast. Here is the quick post that I wrote before I went to the hospital.

As I mentioned last week the low last week, if that was a major low, wasn't a great low for bulls as it left decent looking H&S patterns forming on SPX, NDX and RUT. Here's how that would look on SPX:

There's definitely unfinished business below, and a move up directly from here would suggest strongly to me that we'd see a move back to test these levels again later in the summer. Looking at ES on Friday and overnight though, there is still a strong possibility that we could see a better low made now. The trading stats for this week are grim, with (from my Stock Trader's Almanac) Dow down the last eleven trading weeks after June opex and down 18 of the last 20, with an average loss of 1.2%. It wouldn't take a lot to reach the support trendline on SPX from here:

Vix closed back within the daily bollinger bands last week, and another red candle on Vix today would confirm a Vix buy signal for equities. The reliability on these signals isn't bad at all and that's something to watch today:

EURUSD has peaked slightly short of my Friday morning target (so far) and if we see an hourly close below 1.42 I'd be looking for a new low. The big news on EURUSD is the Greek vote of confidence in the government today. I think the government may well fall and that could make for an interesting week on many fronts:

The last 90s support level on oil I was talking about on Friday morning held on Friday but failed overnight. That clears the path for oil to retrace to the mid-80s and looks bearish for equities too:

I have an additional chart to post today on top of my own and that is a great chart from Gann360, who many of you will remember from a while ago at slope posting as Joe8888. Gann360 is his twitter handle and I originally joined twitter just to follow him, as his charting is superb and always well worth keeping an eye on.

All in all I'm leaning bearish here, but the key indicator that I'm watching today is the Vix. A confirmed Vix buy signal today would definitely be bullish.

POTW: The YMCA Dance

By -

Most of you have probably had the uncomfortable experience of being asked to participate in the YMCA dance. You know the one, right? It's the "dance" in which the ancient song "YMCA" by the Village People is played, and people all jump around, trying to form the individual letters as they are sung by the group.

I suppose it's popular because it's really easy to do – – even four year old kids do a respectable job of forming the letters (and – hey – maybe for them it's even educational). But I would think for most adults – certainly most Slopers – the entire thing is embarassing. And, beyond that, the repetition of the song gets old really fast. To say nothing of the fact that, unbeknowst to a lot of the people hopping around forming letters, the entire premise of the song is picking up strangers for casual sex. No thanks. I'll just order another drink.

0531-ymca