
Slope of Hope Blog Posts
Slope initially began as a blog, so this is where most of the website’s content resides. Here we have tens of thousands of posts dating back over a decade. These are listed in reverse chronological order. Click on any category icon below to see posts tagged with that particular subject, or click on a word in the category cloud on the right side of the screen for more specific choices.
Black and White Thinking
I present you Justice in America:
This Maddening, Trendless, Schizo Market
Anyone else feel seasick? I bet a brilliant strategy would be to go long at the end of each down day and short at the end of each up day. That's bound to have produced amazing results recently.
Goldbug Headlines
Actual headlines from a popular internet site. Don't take this the wrong way, because I highly respect a couple of the names below. But if you think this is bullish… think again.
Rick Rule – Silver Will Trade Like an Internet Stock to the Upside
Turk – Gold & Silver Have Bottomed, Summer explosion Ahead
Embry – System Wide Meltdown as US to Enter Hyperinflation
Eric Sprott – We're Headed off a Cliff, be Wary of Paper Assets
Hathaway Confirms Gold to Trade in the 5 Digits
Jim Sinclair – Gold to Exceed $12,500 to Balance US Debt
The problem with deep thinkers in the gold 'community' is that their subject matter is very dynamic and usually flat out scary. So how does one get one's deep thoughts out to the greater world in an organized and strategic way so as to minimize stirring the herd up and getting their emotions all in an uproar (and panties in a bunch)? Answer, it's impossible. These sites get a lot of traffic and new gold bugs – complete with new Gold 101 manuals from which they read and lecture – are minted every day.
It's just that in its interim swings, the markets sometimes fail to get and play by the memo.
Mixed Signals (by Springheel Jack)
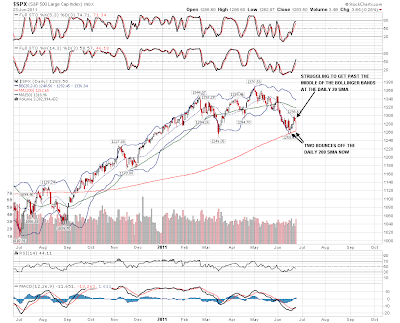
The action on equities looked pretty bullish to me yesterday, with the SPX falling from a higher high, and bouncing at a higher low from the daily 200 SMA, which was hit for the second time in recent days. SPX then recovered much of the losses from the morning and the previous day. Here's the daily SPX chart with bollinger bands to show those bounces, and the failure so far to get past the middle of the bollinger bands at the daily 20 SMA:
On NQ the IHS that we have been watching form this week is now complete, waiting only for NQ to break resistance at 2250 with confidence. That hasn't happened yet and might not happen today:
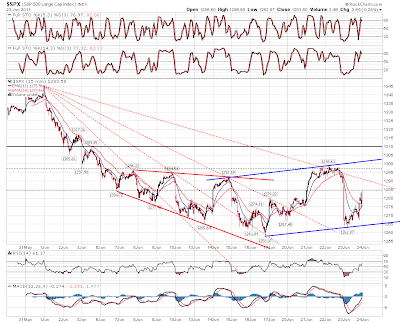
On the shorter term SPX chart a wide and shallow rising channel may be forming (thanks to Nugie for pointing these out on SPX and RUT yesterday afternoon):
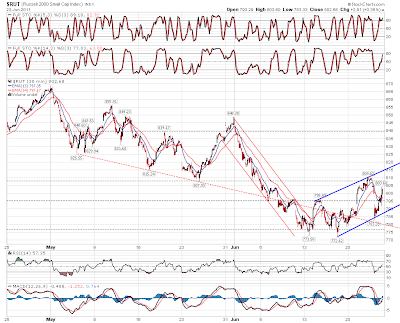
A similar rising channel has formed on RUT:
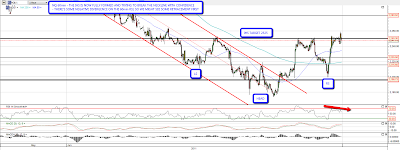
On equities this is all therefore looking fairly bullish, but it's when I look at other markets that I'm seeing a few flies in the bulls' soup today. EURUSD obviously had a big fall and less big recovery yesterday. It's fallen back somewhat overnight, but the chart that drew my attention today was the UUP daily chart with the huge year old fully formed falling wedge. The EURUSD move down yesterday poked through the upper wedge trendline which is often a sign that the wedge is about to break. If EURUSD closes a day near yesterday's lows at 1.414, then that wedge will break:

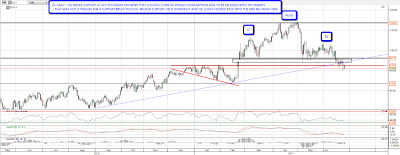
The key trendline on silver at the moment is the rising trendline from last August which was hit for the fourth time yesterday and held. Overnight though silver has tested it again and has penetrated the trendline on an intraday basis. If that trendline breaks on a daily closing basis then the way is open for silver to fall to test support levels lower down. July is a weak month for silver generally and the average summer silver retracement bottoms at the end of July. If the trendline breaks we could well see a sharp downward move.

Oil fell yesterday as it was announced that strategic reserves equivalent to 17 hours of world consumption will be released over the next month. That pushed /cl through 92.5 support and that broken support held as resistance overnight. The technical picture on oil already looked precarious and I'm expecting to see oil back in the 80s very soon. I have a variety of targets for the move down ranging from the early 70s to the mid 80s, but there's decent support in the mid-80s, so that's the first target:
I've been writing about a possible interim top in treasuries for a few weeks now, and I'd expect them to fall if equities rally strongly. I was a bit surprised therefore to find a 69% bullish rectangle on the futures yesterday. The target on a break up would be in the 128'05 area and these tend to be solid performers on breaks up, with Bulkowski giving 80% odds of the upside target then being reached. Definitely something to watch:
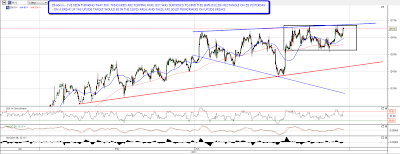
On these last four charts it's important to note that support on silver, and resistance on UUP and ZB, are still holding so far, even though it seems they may not hold much longer. If these trendlines break though then four separate markets that are all correlated with equities will be breaking in directions that suggest weakness on equities. I'll be keeping a close eye on all of these.
Short term the equity bulls are holding their ground, but need to break overhead resistance to deliver the multi-week rally that I've been expecting. The key levels in my view are that NQ must get above 2260 and hold above it, and ES must do the same with 1293 and then 1300. Fridays and Mondays have been fairly bearish lately, so that might have to wait until Tuesday.
