
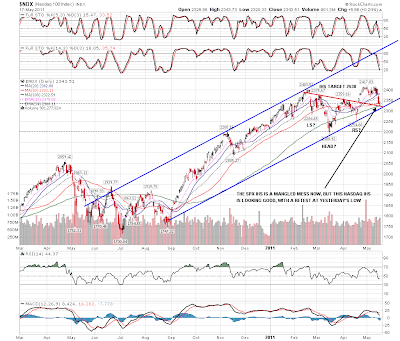
I'm very skeptical about a major top being in and as a result I'm looking harder for a low than I otherwise would. That's something I'm wary about, as a good chartist looks at the charts and draws conclusions from them, rather than starting with a conclusion and then trying to find evidence that fits that conclusion. Nonetheless SPX reached a strong candidate for a low yesterday IF the uptrend from the March low is still intact, and that was at the previously notional lower trendline for a rising channel from that March low. Here it is on the 60min:

That may well be significant, as the short term declining resistance trendline I posted yesterday on ES broke up overnight, as did main declining resistance on silver and the current declining resistance trendline on copper. The odds look good for a rally from here as a result, however far that goes. On the SPX daily chart the daily 50 SMA was pinocchioed but held on a closing basis. That could hold as support:

We've also reached a candidate support area on Nasdaq. The SPX IHS is trashed now I think, but there's another on NDX which is still looking ok and yesterday's low retested the neckline for that:
The Vix has reached the target resistance zone which has held since March. If the equities uptrend is intact then it should reverse near here:

The short term resistance trendline I've been using on copper also broke up overnight. There's strong resistance overhead, but if copper can close an hour above 410 then I'd be looking for further upside from there. As it is the low on copper was last Thursday, and it has therefore been showing positive divergence from SPX since then:

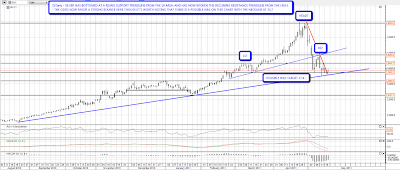
I was speculating yesterday that silver might well soon break up through declining resistance from the highs and it has done that with confidence overnight. Looking at the daily chart you can see that the low on silver (so far) was at an obvious support trendline, and with the declining resistance break I'm seeing a possible bounce to the 40 level here. Bounces on silver and copper should be positive for equities and negative for USD of course:
Gold briefly broke down from the broadening ascending wedge I posted yesterday, but closed the day well within it. I'm inclined to take this as an indication that the wedge will break down rather than up in due course, but no major damage has been done to the uptrend yet. I've marked up the obvious IHS just to show that it has already played out to target and should be disregarded:

If I'm right about what the silver and copper charts in particular are telling us then it's important that yesterday's low holds on ES, and I'd be looking for the current move down to find support in the 1320-2 area, as there's a potential IHS forming on ES now, and that was where the left shoulder bottomed. If this completes and plays out, the target would be in the 1348 area. Here it is on the ES 15min chart:

In summary there's the potential for a serious rally to start today, which might potentially take us to new highs to deliver a major top in the June/July timeframe, which would fit better with what I've been expecting. The IHS target would be 1348, and if ES can clear 1350, then I'd expect new highs.
