
Waiting for the retracement within the rising channel on SPX has been a bore. The strong resistance trendline has been holding well and it seemed just a matter of time until we saw at least some retracement. However SPX broke above rising channel resistance yesterday and while it may fall back inside today, that opens up potentially considerably more upside before a retracement:

What other resistance do we have? Well a key resistance level on SPX is the weekly upper bollinger band. We are now in the third week of moving up under that resistance and it is now in the 1500 area. We may well now see a touch or close around that level this week. As an aside it's worth having a close look at this chart to see how long SPX can crawl up under the weekly upper BB without testing the weekly middle BB (now at 1433). I counted one instance on this chart where that lasted 21 weeks from the first touch of the upper band. Food for thought:

The SPX rising channel wasn't the only pattern in play here, though it was most definitely the most promising for a decent retracement anytime soon. There is also a perfect rising channel on RUT that I'll be keeping a closer eye on now. That has plenty of upside room here and it's worth noting that every retracement or consolidation in the last two months has been signaled with negative 60min RSI divergence, of which there is currently no sign on either the RUT or SPX charts:

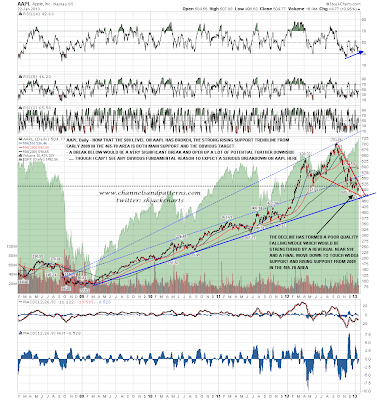
I was chatting to a trader friend in September talking about the impact on the wider equity markets of the sharp fall on AAPL that I was expecting. When we saw that fall it did indeed help shake the markets. What seems strange now though is that, though NDX is underperforming, SPX has been flying up without any support from AAPL. AAPL hasn't been moving much recently and I'm still looking for a hit of resistance in the 518 area before a final low (probably) in the 465-70 area. I understand AAPL earnings are out today and we could see a break up earlier than I expected if they surprise to the upside. The positive RSI divergence on the daily chart is promising for a low already being in, though from a technical perspective I have been expecting a hit of the main support trendline, and we haven't seen that yet. That doesn't always happen though:
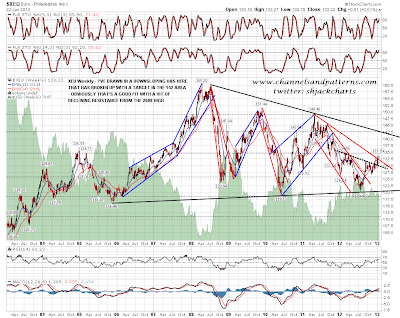
I was talking about a possible EURUSD target in the 1.42 area last week and the chart below shows that scenario, with a downsloping IHS that has broken up with a target in the 1.42 area, which is a good fit with a test of declining resistance from the 2008 high, now in the 1.425 area. I think we may well see this play out:
I can see no signal here for a retracement in the near future on SPX. As long as that remains the case we are running the standard bull run program of an early dip that should be bought followed by strength for the rest of the day. Key support is now at yesterday's low at 1475 ES, and if we see an early dip into the 1480-3 ES area then that would look like a decent long entry level for today. If we see a move below 1475 ES then that would signal that we are in a retracement or consolidation phase that would most likely last at least a couple of days.
