
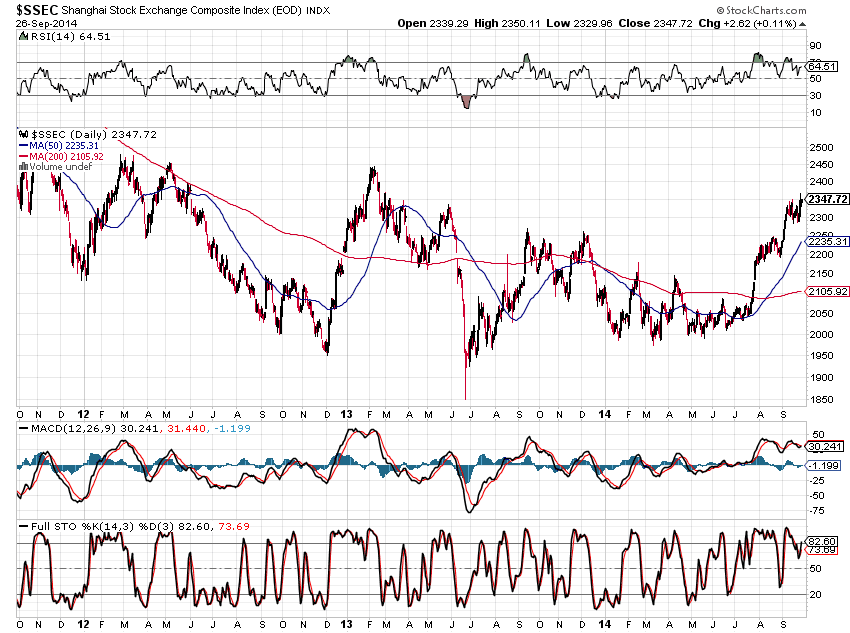
After the run-up that China’s Shanghai Index has had since July of this year, this index may be on the verge of either a sizable decline or a somewhat volatile, and possibly lengthy, consolidation shortly.
The following 3-Year Daily chart shows SSEC to be at a major resistance level, and the RSI and MACD indicators are already in decline and do not support a further advance in SSEC.
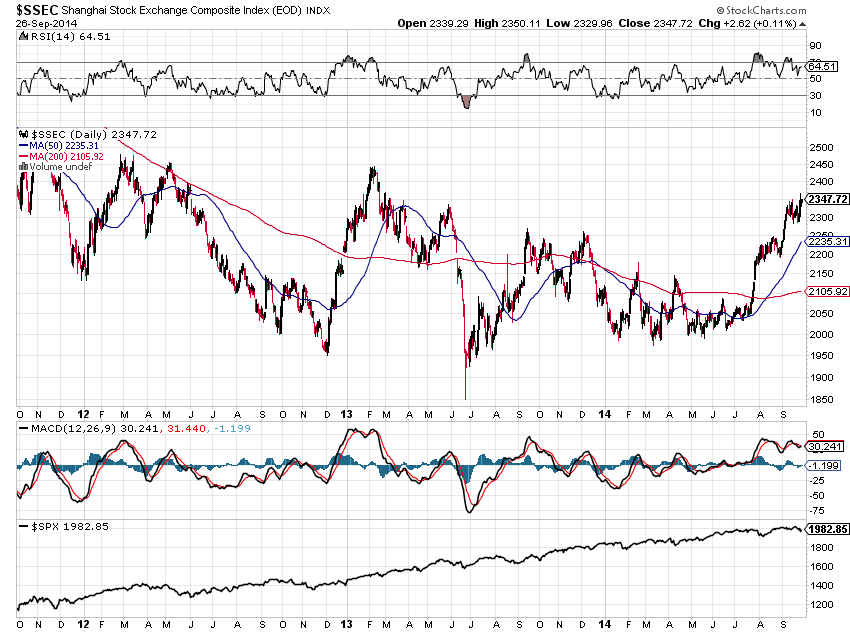
The following two 3-Year Daily charts show the relationship of SSEC with SPX. The first shows the SPX below, while the second shows a ratio of the two indices.
The second is of most interest to me, since price on this ratio is also at a major resistance level. Furthermore, the RSI and MACD indicators are also in decline and do not support a further advance in SSEC.

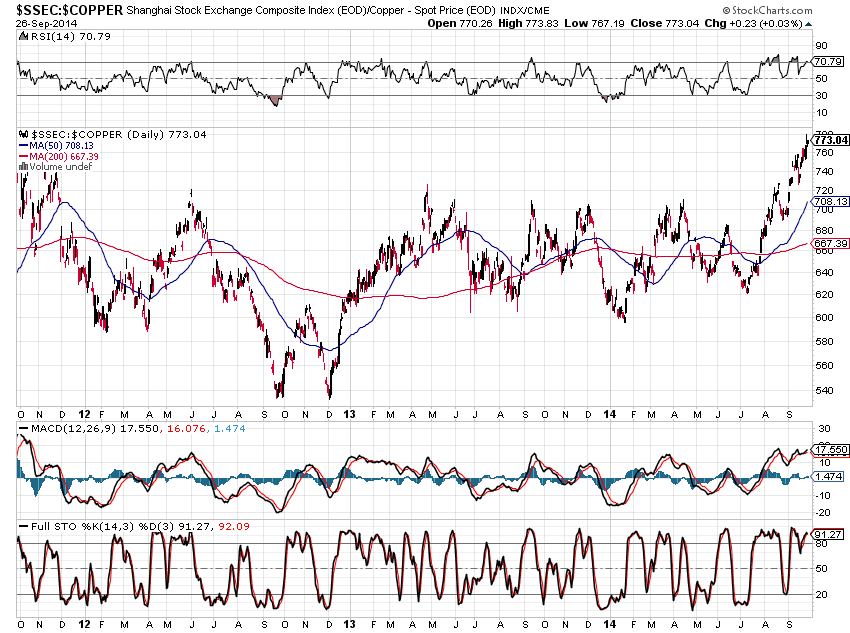
The following two 3-Year Daily charts show the relationship of SSEC with Copper. The first shows Copper below, while the second shows a ratio of the two indices.
As shown on the first chart, the price action of the SSEC and Copper are normally (roughly) in sync; however, they have been at variance since July. The second chart shows that this ratio popped above a resistance level in September, but the RSI and MACD indicators are in decline and do not support a further advance in SSEC.

So, China’s Shanghai Index, in relation to either continued strength or upcoming weakness against the SPX and Copper, is worth watching closely over the coming days/weeks for any China buffs.
Enjoy your weekend and best of luck next week!
