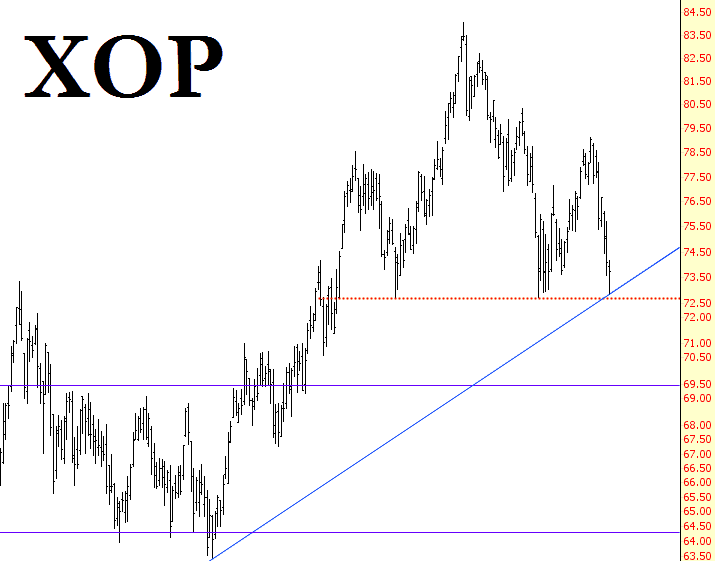
Oil and gas companies have been taking it on the chin recently (largely, I suppose, due to crude oil’s plunging price). We’re at an important support level now, represented by a multi-year trendline. If this line breaks, the fall is going to accelerate, because it has a well-formed head and shoulders pattern working in its favor now as well.
Slope of Hope Blog Posts
Slope initially began as a blog, so this is where most of the website’s content resides. Here we have tens of thousands of posts dating back over a decade. These are listed in reverse chronological order. Click on any category icon below to see posts tagged with that particular subject, or click on a word in the category cloud on the right side of the screen for more specific choices.
“Boxer Shorts” from Harry Boxer
Swing Trading Watch-List: ADSK, APA, BX, UNM, CY
A Decent Start
SPX broke down and closed under H&S support yesterday, and that H&S has a target at 1969, close to 38.2% fib retrace target at 1970, and the 50 DMA at 1971. There is obvious significant support at that target. The low yesterday was a test of the daily middle band, and that is holding so far.
I was disappointed to see the daily RSI 5 close at 35.19. The possible low range starts under 35.0, so that does mean we have at least one more weak daily close within this signal, but once we see a close under 35 then there is a one in four chance of making a low between 30 and 35, and when the RSI 5 hits 30 on a daily close then the signal has made target. SPX daily chart:
Revenge of the FASholes
Financials are a peculiar sector, because one didn’t have to nail the March 2009 bottom in order to get a bargain. Indeed, one could have waited about two and a half years – – until October 2011 – – to get incredibly cheap prices. Since then, though, they’ve been marching ever-higher, just like everything else.
However, I noticed an interesting break in the FAS trendline (FAS being the triple-bullish leveraged ETF for financial stocks). Regardez, s’il-vous-plaît………


