
Yesterday I was talking about the strong resistance overhead and what I was talking about was rising megaphone resistance from the 2011 low. That should be strong resistance now and in fact is even stronger than it looks, as on the monthly chart that resistance trendline is anchored at the 2009 low. I am not expecting that resistance line to be breached, with the possible exception of a bearish overthrow, until this rising megaphone has broken down and made target at a fib retracement in the 38.2% to 61.8% fib retracement range.
That’s not to say that SPX couldn’t rise further within this pattern, the pattern is rising by about 20 handles per month and would end this year in the 2350 area, I’m just saying that with strong resistance now in the 2120-30 area, and rising at only 20 handles per month, there can be no strong trend up move that would start here and last more than a couple of weeks. To get that sort of move SPX needs to retrace further to create some headroom, and ideally test or break rising megaphone support, now in the 1865 area.
We could see an important milestone in this decline made today if SPX can close well below the weekly middle band at 2014. If we see that conviction break then that would open up the 50 week MA at 1948 and the weekly lower band in the 1908 area as targets. SPX weekly chart:

There is a significant level on the downside today as well and that is that, while ES has made new retracement lows in globex, that new retracement low hasn’t yet been seen in trading hours. As long as that remains the case the gently rising channel that was established at the low on Wednesday remains unbroken, and the scenario I mentioned yesterday of making another new all time within this topping process remains open. A break of that low in RTH will kill that scenario, which would be reassuring. SPX daily chart:

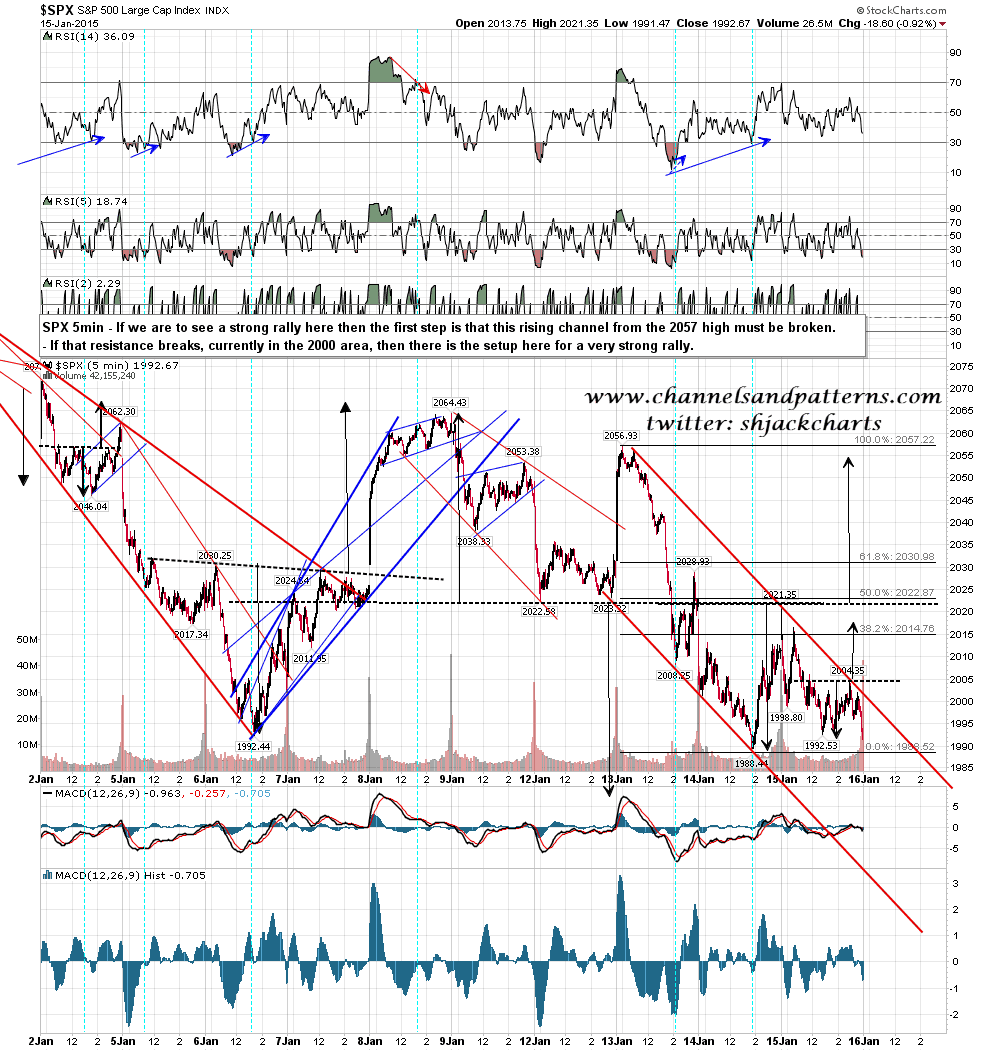
The move down from the 2056 high has resolved into a decent falling channel. Any rally would only really get serious on a break above channel resistance. I have that as key resistance in the 2000-2 area. SPX 5min chart:
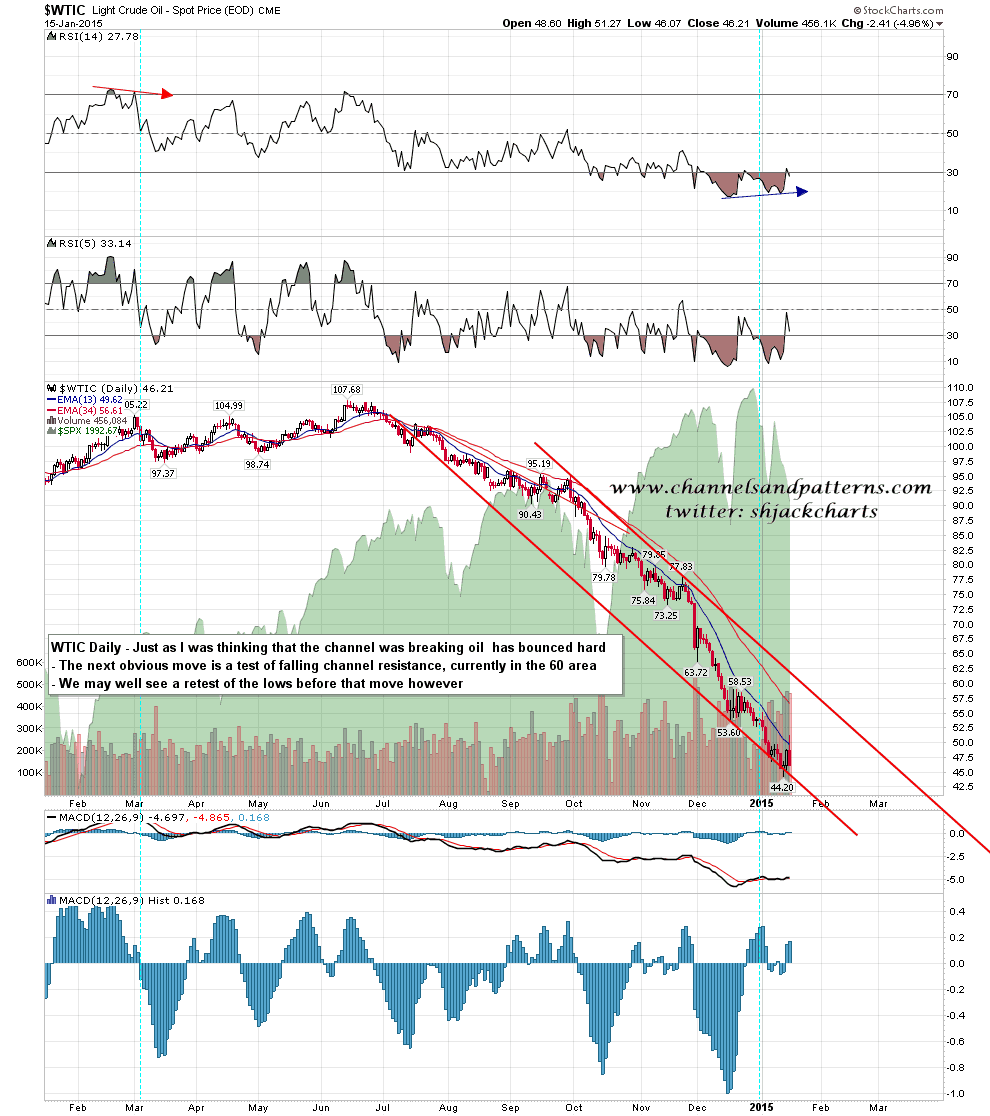
Oil has finally bounced, just as I was reaching the conclusion that my strong support trendlines were breaking. The next obvious target is channel resistance, currently in the 60 area, We may see a retest of the low first. WTIC daily chart:
This is an important day from a technical perspective. If bears can make a new retracement low in RTH and hold the falling channel then the downside opens up and channel support is currently in the 1960 area and falling fast. If bulls can avoid the new retracement low in RTH and break the falling channel from 2056 then we could see a very strong rally that might extend this already interminable topping process another couple of weeks.
