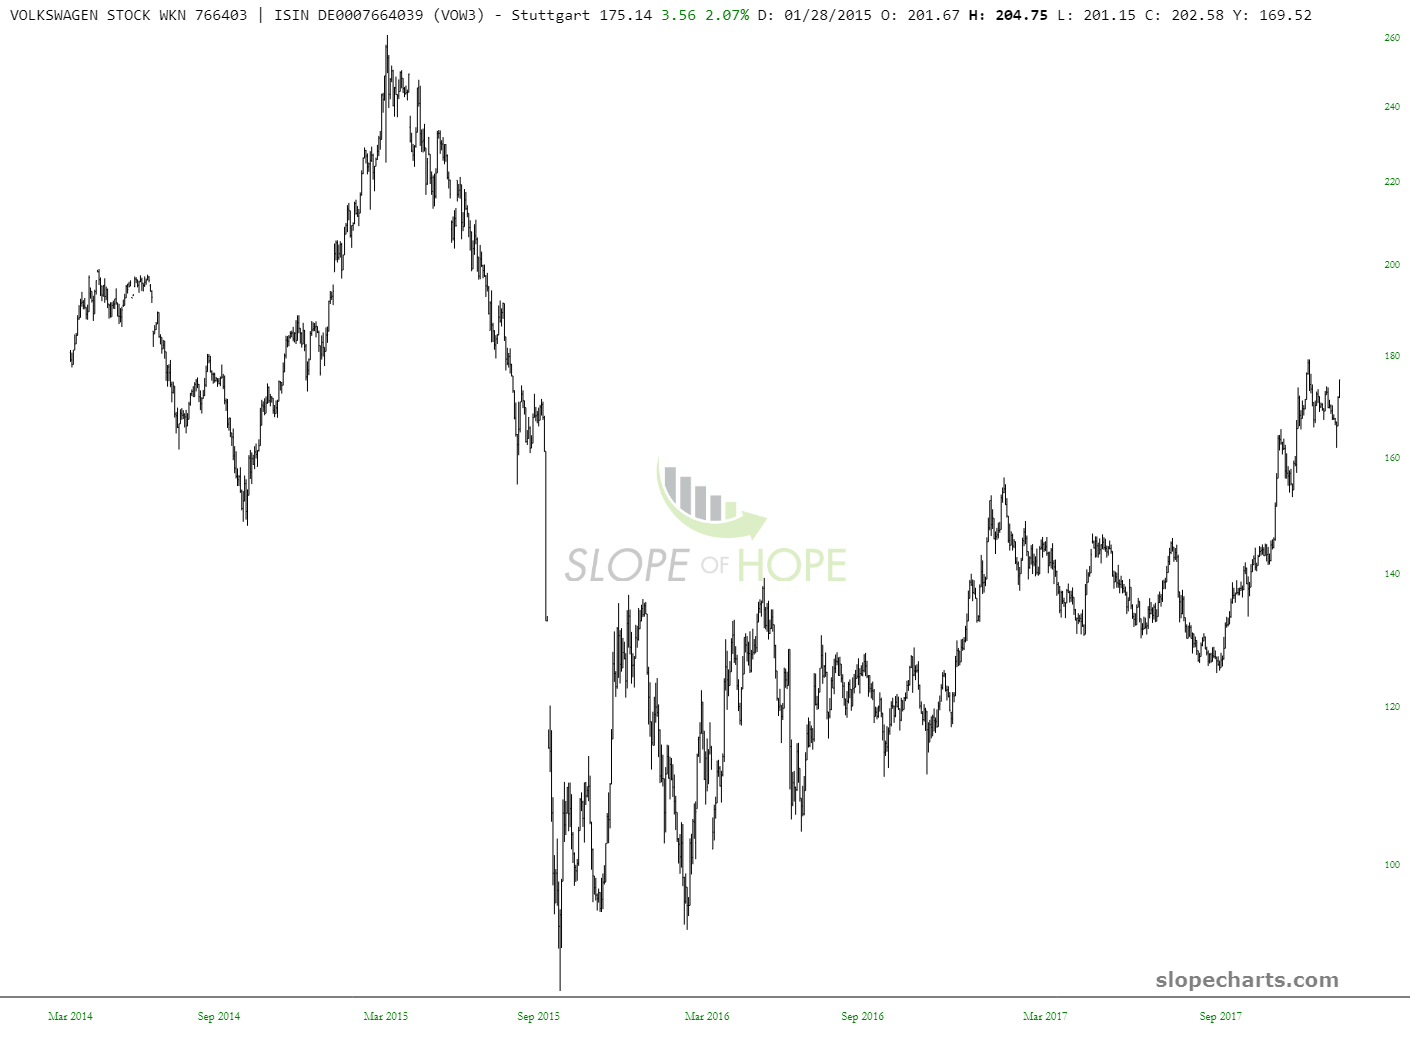
Well, folks, I’ve just made SlopeCharts do yet another thing ProphetCharts was never able to do – – give you German stocks! I am charging the same rate for access to this data as I am charging for SlopeCharts: $0.00.
Slope of Hope Blog Posts
Slope initially began as a blog, so this is where most of the website’s content resides. Here we have tens of thousands of posts dating back over a decade. These are listed in reverse chronological order. Click on any category icon below to see posts tagged with that particular subject, or click on a word in the category cloud on the right side of the screen for more specific choices.
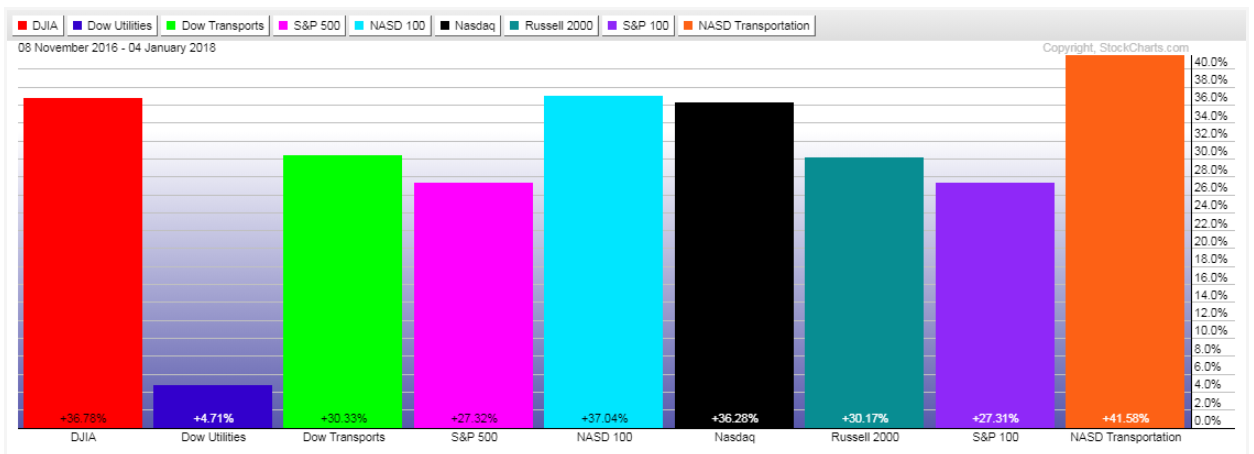
U.S. Markets Make Titanic Gains Post-2016 Presidential Election
Since November 8, 2016, the following percentage gained/lost graphs show that, to date (as of Thursday),
- 8 of 9 Major Indices increased from 27.31 to 41.58%, while the 9th posted gains of 4.71%
- 6 of 9 Major Sectors gained from 26.09 to 44.69%, while the remaining 3 gained from 8.93 to 12.37%
Singles Bar

A Couple of Semiconductor Shorts
Where It’s At
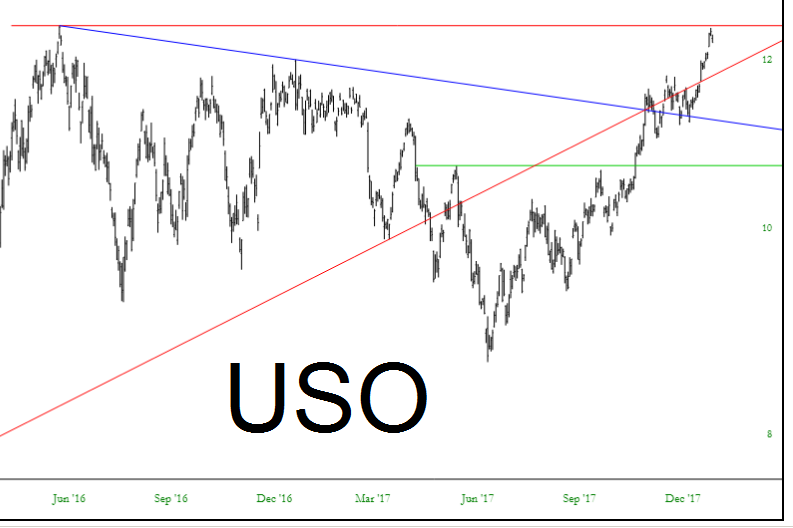
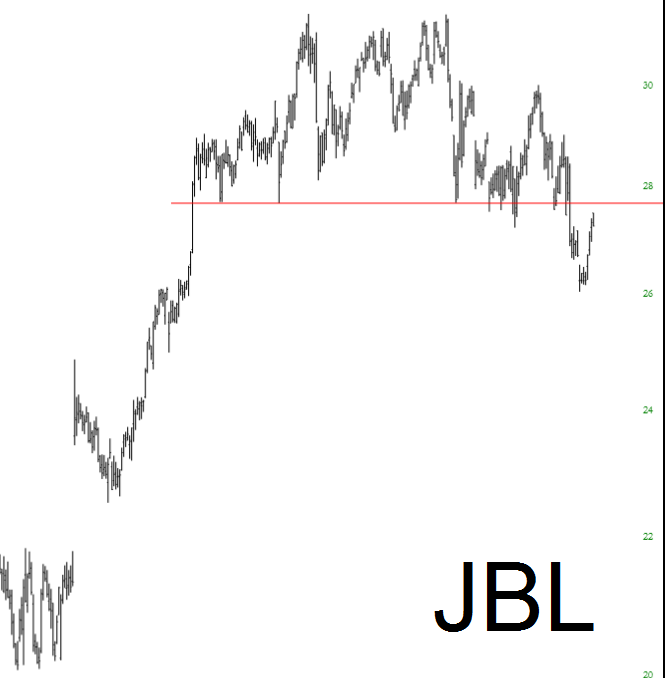
Just a trio of charts with a few words on each. Oil has had a tremendous rise for half a year; I think crude could get as high as $67 or so, but it seems to me it’s time for a temporary breather and small retrace.