
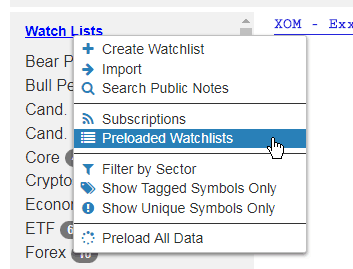
Let’s take another real-life example of using SlopeRules that lead to some interesting charts, shall we? Begin by clicking on the Watch Lists header, which reveals a menu. Select the Preloaded Watchlists item.
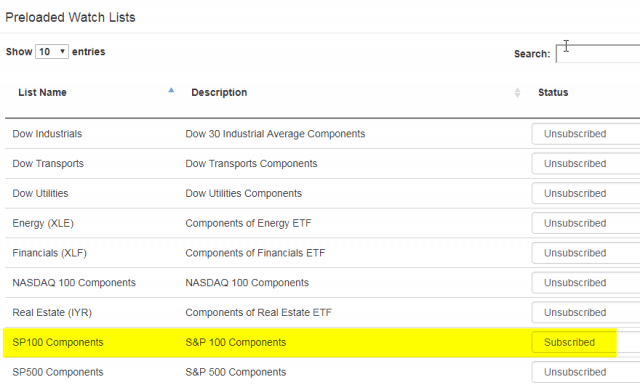
We decide to survey the components of the S&P 100 for trading opportunities. So we choose “Subscribed” on its dropdown.
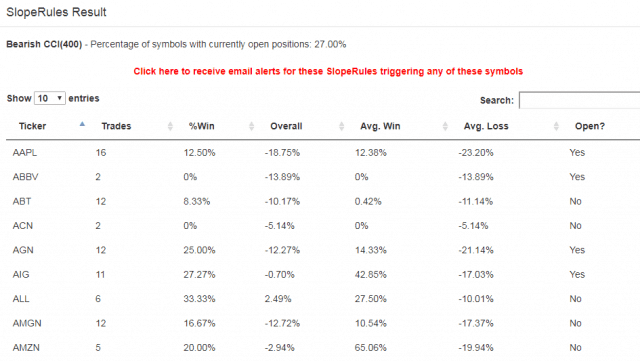
Now we can right-click on this new entry in our watchlists and apply SlopeRules. Here I have chosen the “Bearish CCI(400)“:

After the processing is complete, the results list is shown. Here we can see each of the 100 symbols and their “experience” with this particular SlopeRules set. We can click on any column to sort based on that column’s contents.
I’m interested in historically the biggest price changes, so I click on Average Win. I then focus in on symbols which presently have open positions and which have had a reasonable number of trades in the past.
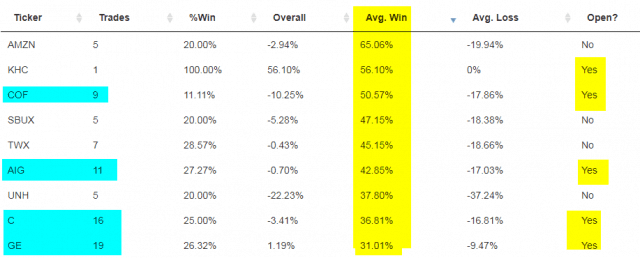
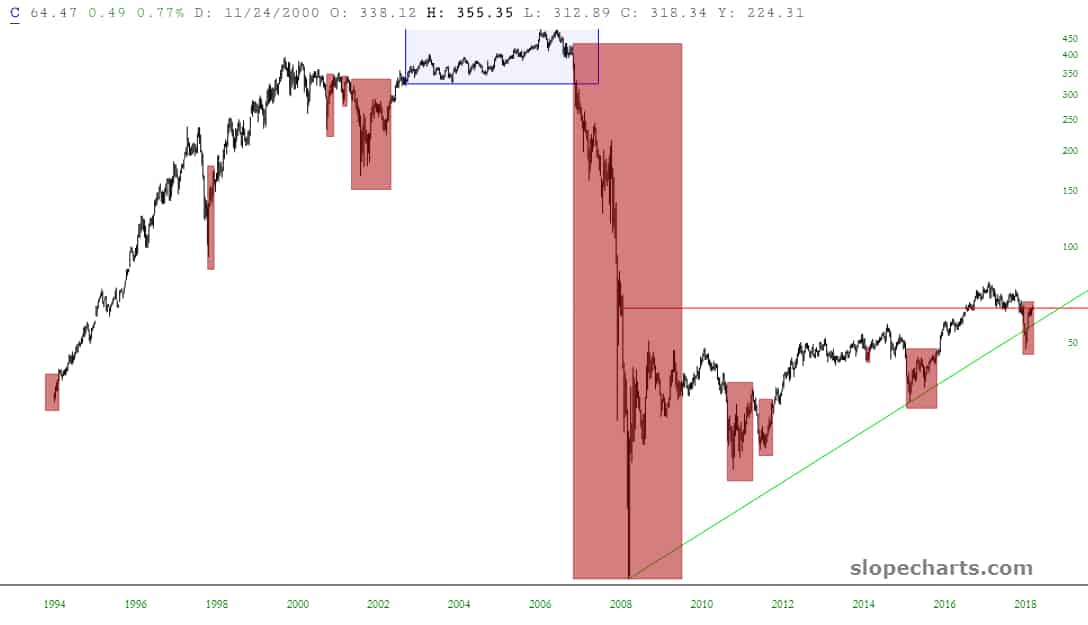
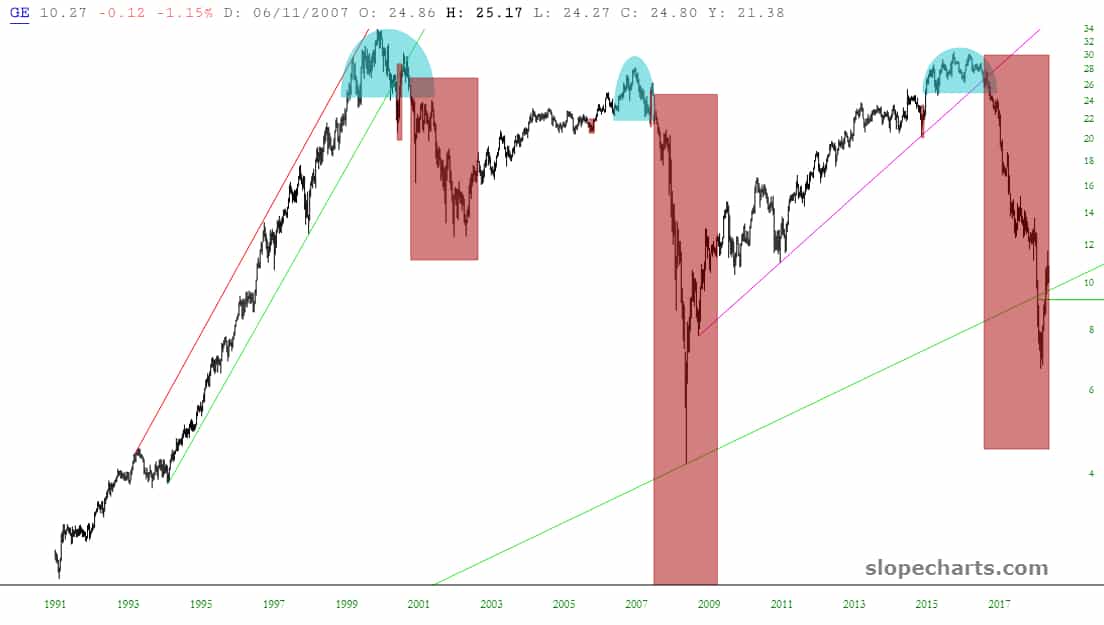
Based on this quick survey, four symbols stand out: COF, AIG, C, and GE (interestingly, all of them financials in one form or another). I apply the SlopeRules to each of these four charts, and it shows me the past and current trade rectangles for each one based on the same rule set.
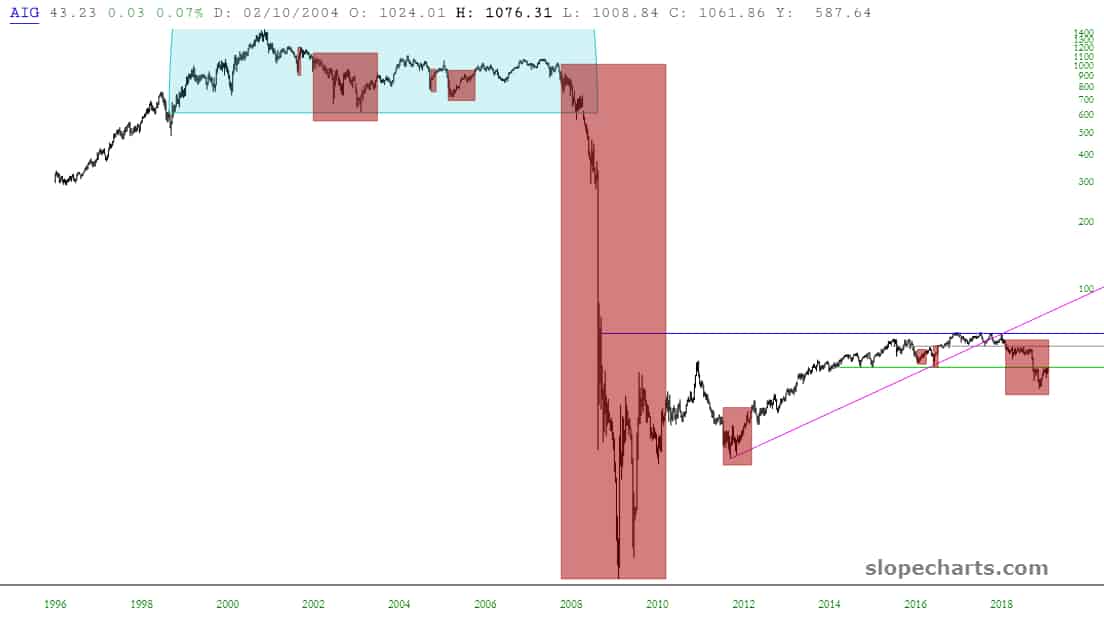
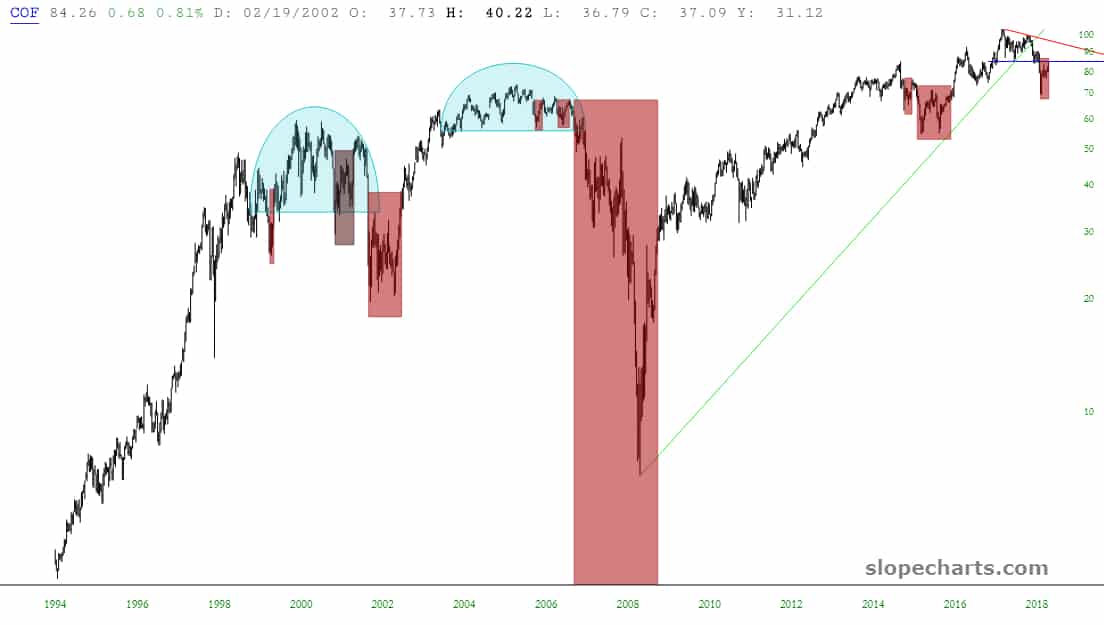
It turns out I’m already short two of these – COF and AIG. I hope this little illustration shows how swiftly you can drill down to interesting insights using SlopeCharts and SlopeRules.
