I’ve been doing this whole “charting” and “trading” thing a long time. I was there for the 1987 crash, as well as the bull market that led to it. I can remember the market’s response to the invasion of Kuwait like it was yesterday. The Internet Bubble. The crash of 2001. 9/11. The financial crisis. And on and on and on.
But I’ve never seen anything like what we’re seeing now. You’d think that, in the 11th year of this pre-fab bull market, some two-sided action might be creeping in, but, nope. This entire thing is starting to feel permanent. And it feels like the MMT lunatics are going to end.
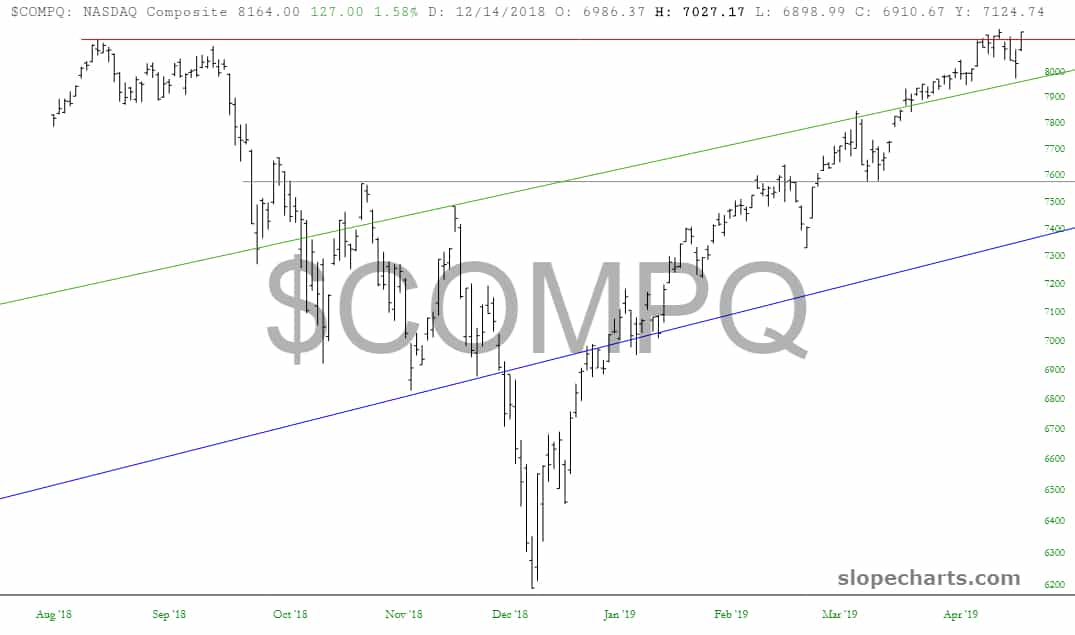
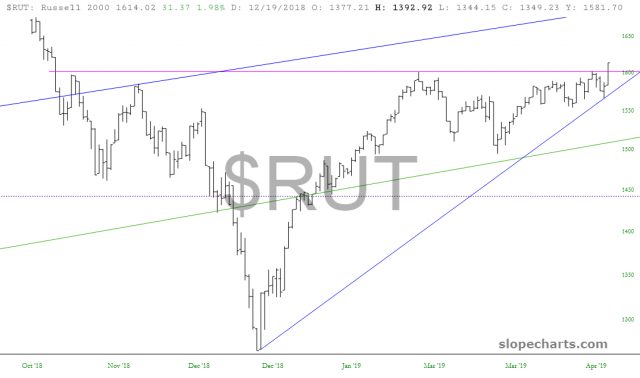
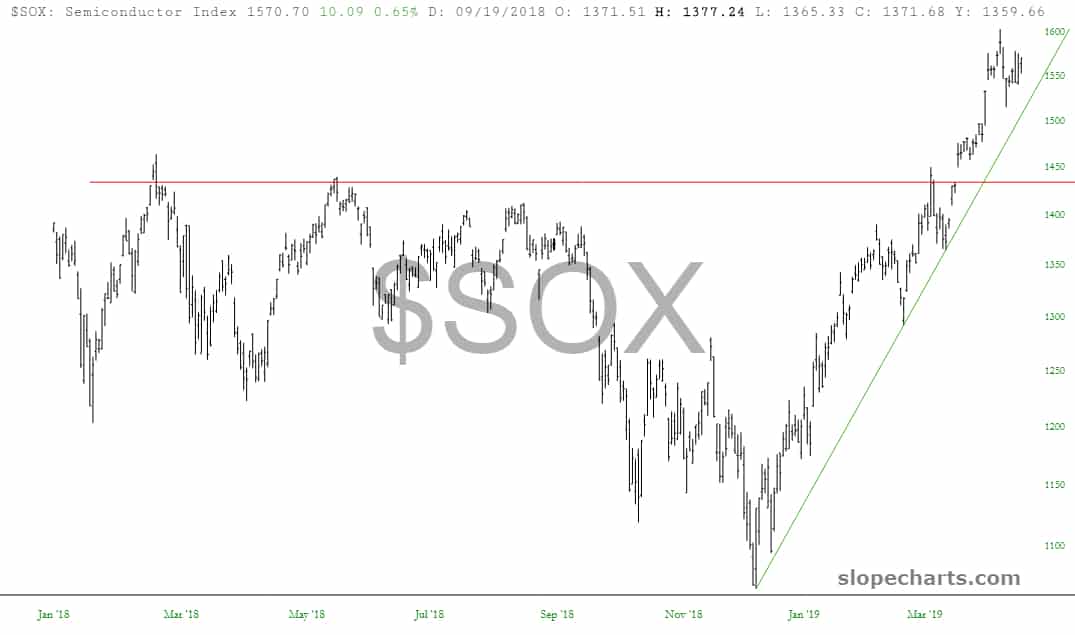
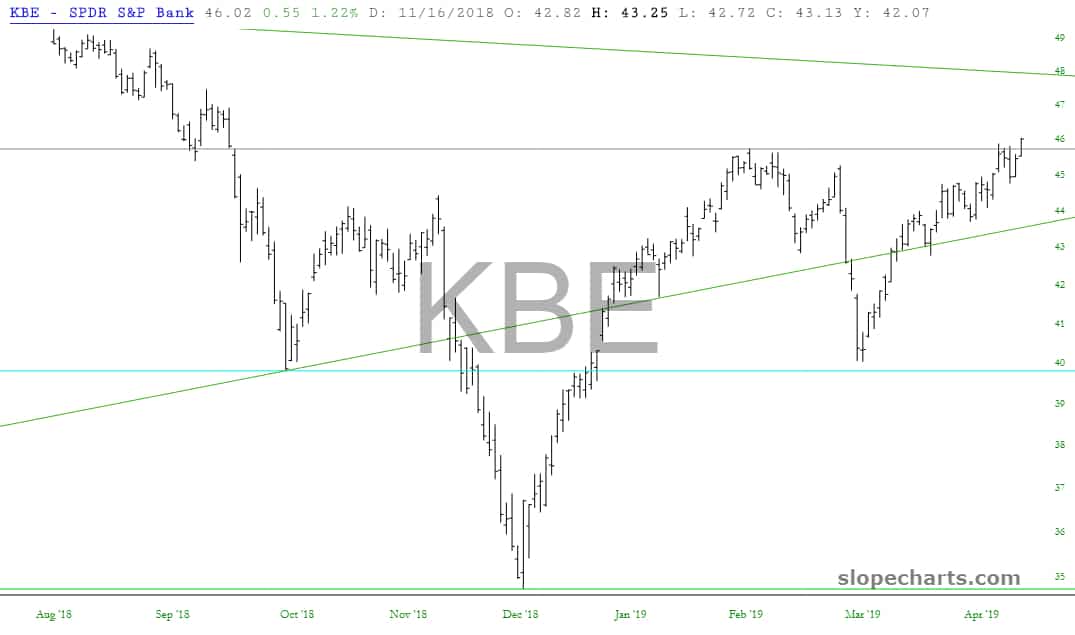
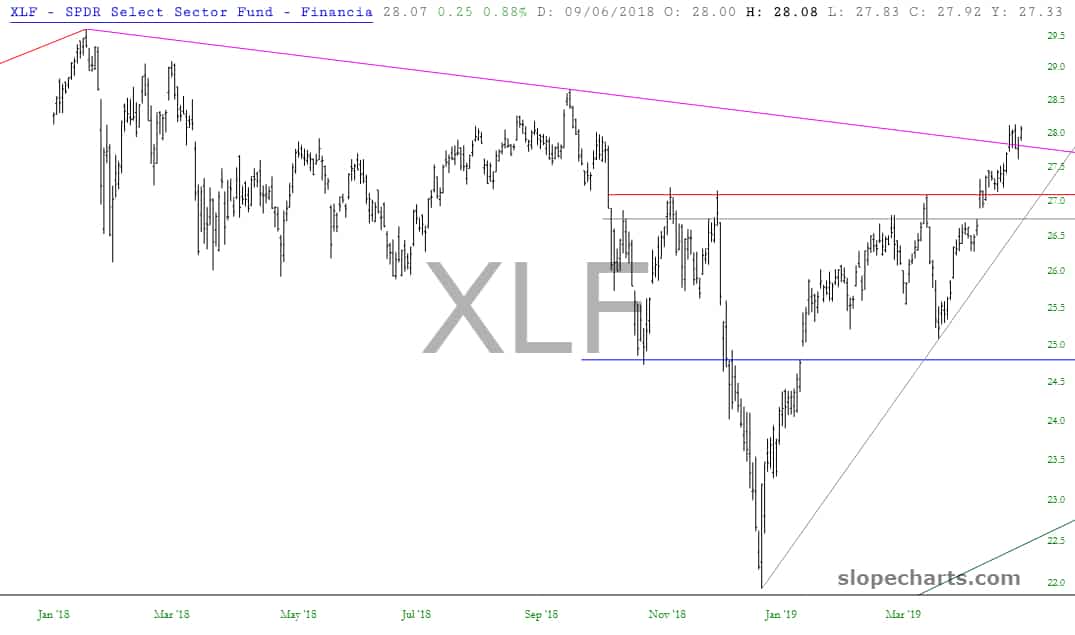
Anyway, below are some major indexes and ETFs along with their breakouts:
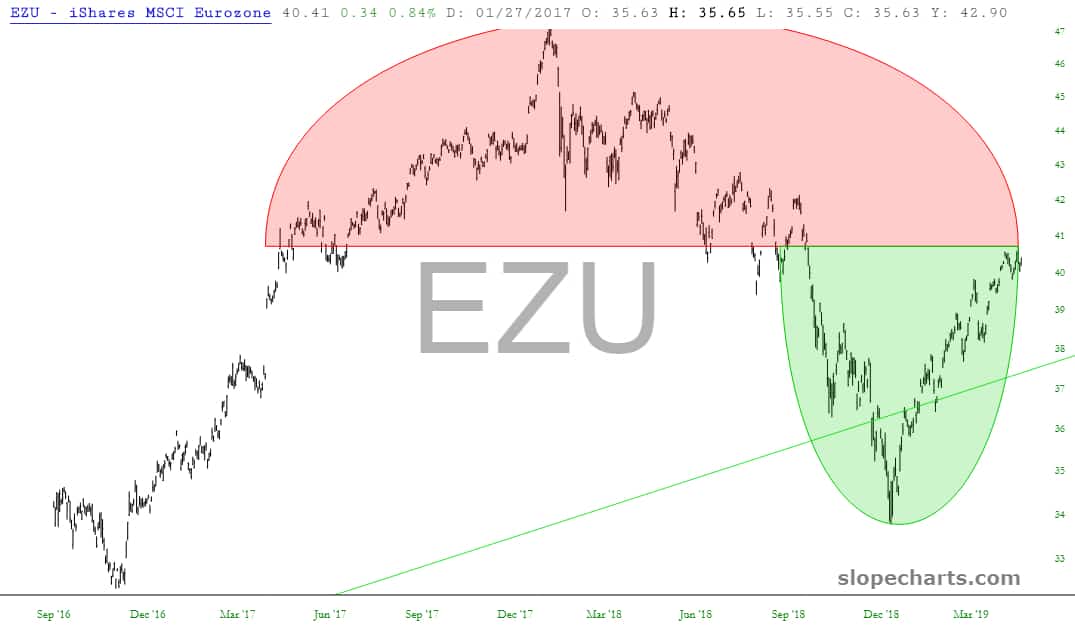
On a global scale, the bulls and bears are still duking out, as shown below – – Beyond Meat notwithstanding:
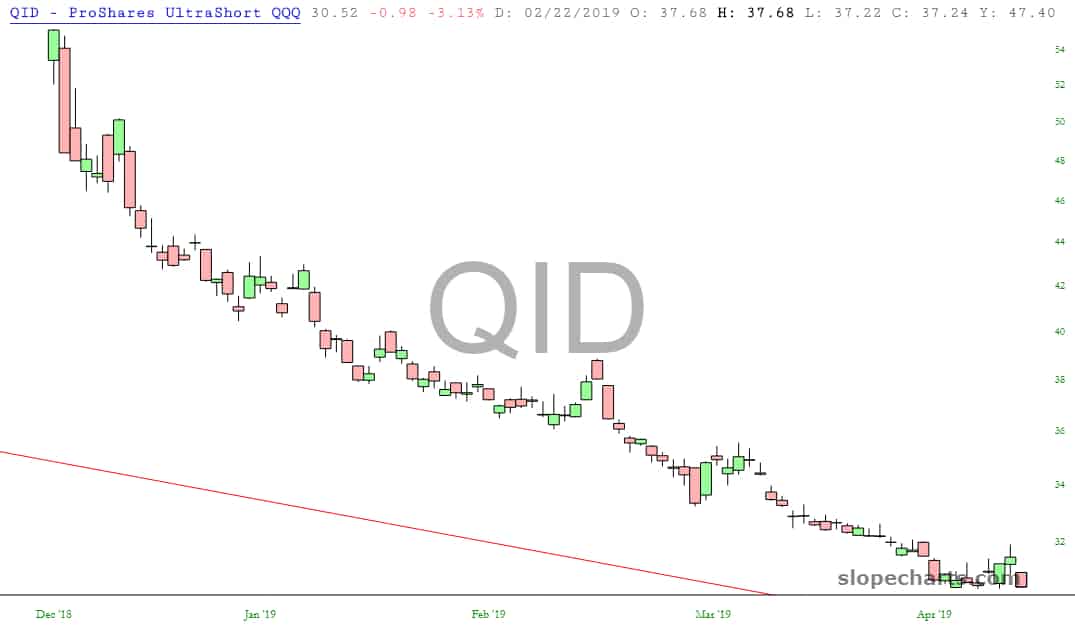
But from Christmas forward, it’s been nothing but a bull orgy. Just look at the ultra-short ETF on the NASDAQ, which has lost nearly half its value since the Christmas peak.
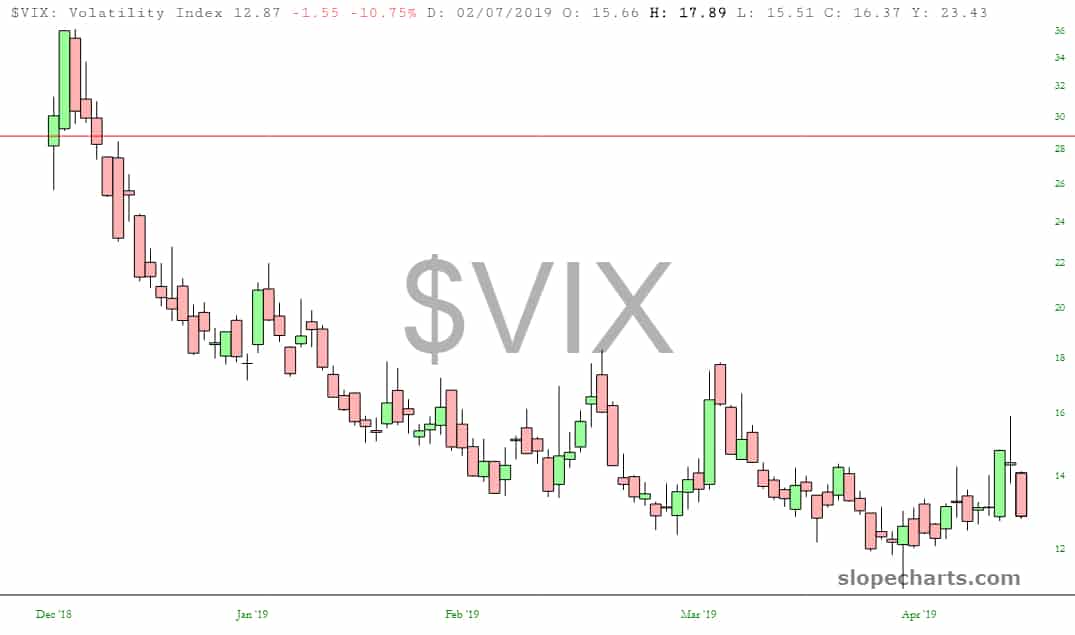
And the poor volatility index couldn’t even manage to stay in the teens. We’re back at a 12-handle, which is pretty much as low as we get these days.