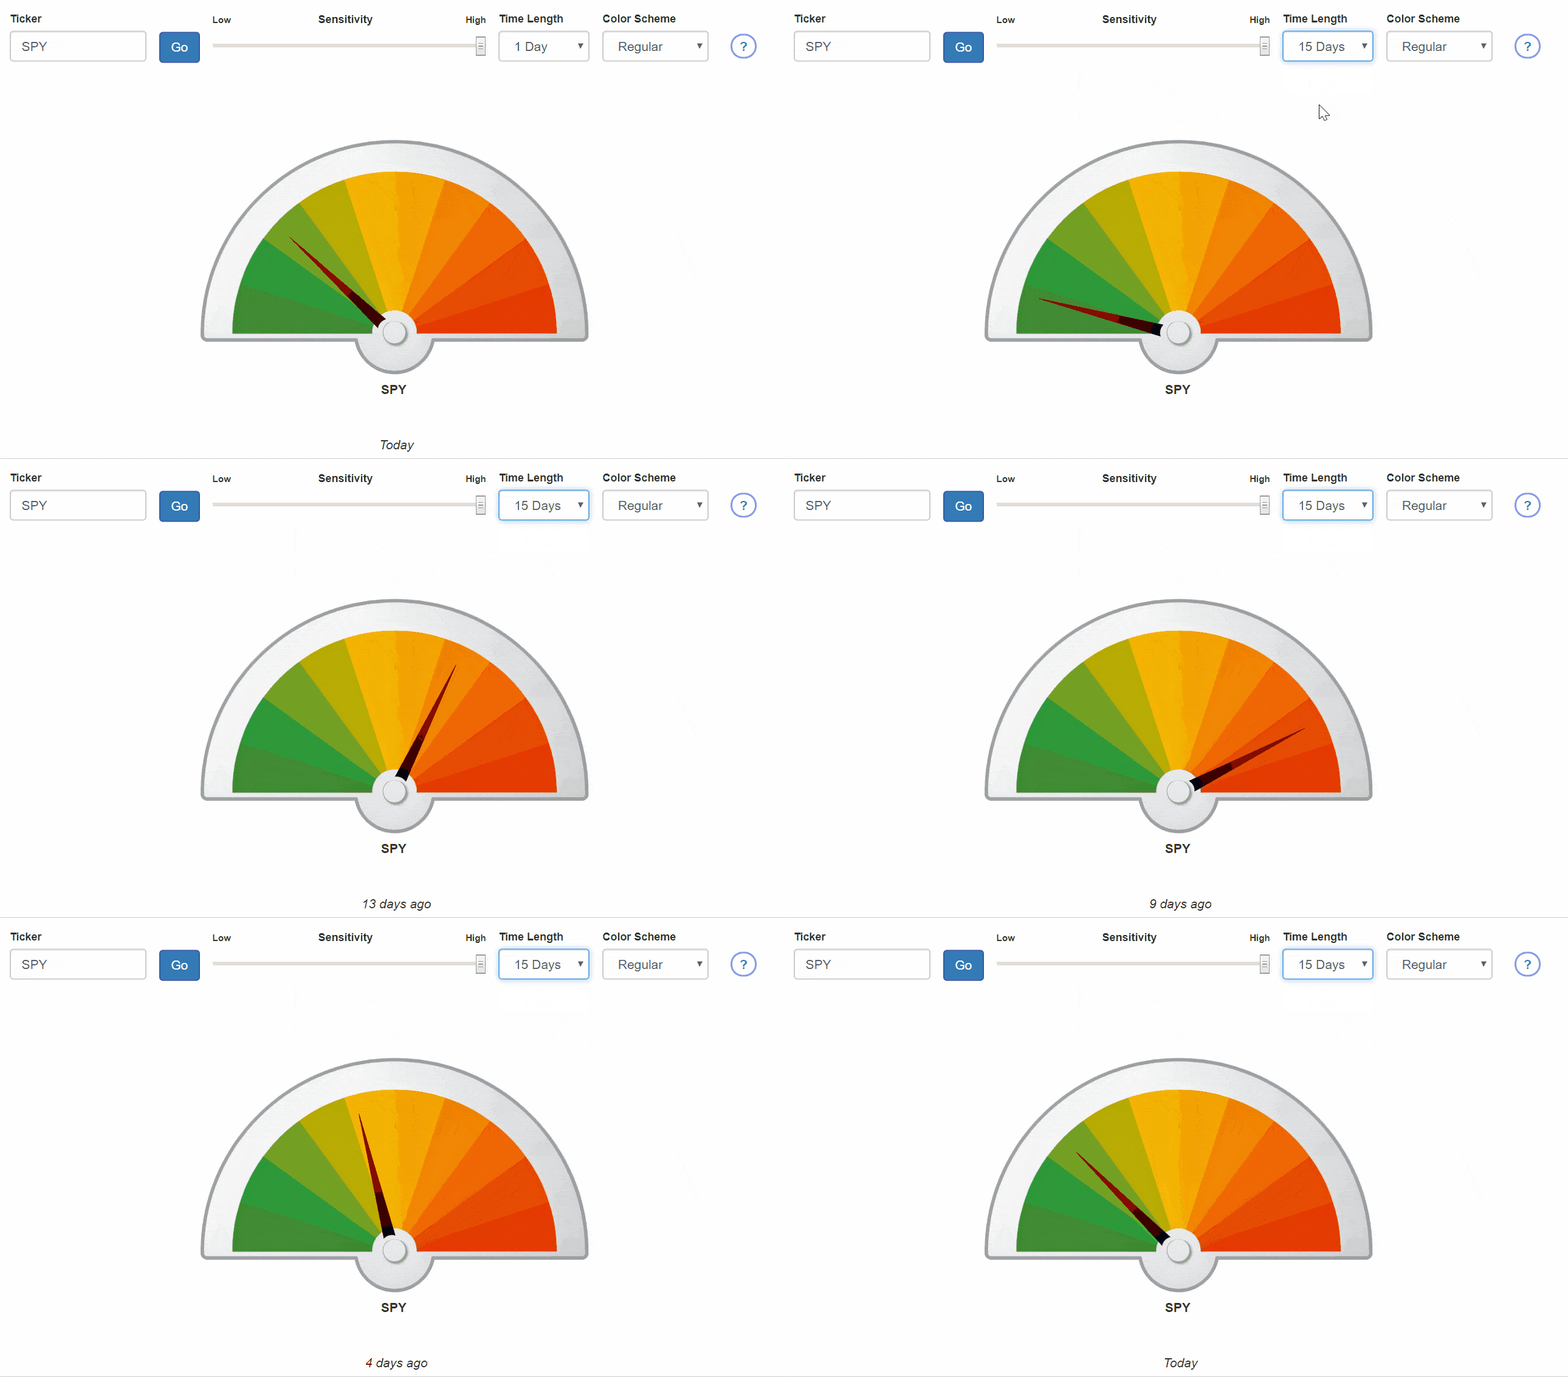
I have been champing at the bit to show you this one, and I am delighted to let you know of yet another Slope innovation: Market Meter.

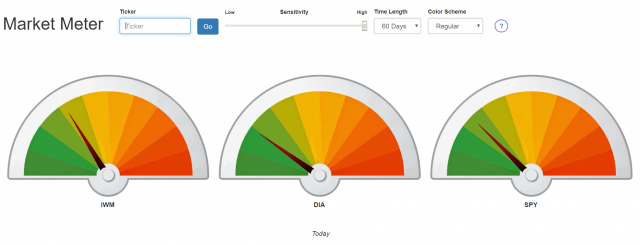
Market Meter provides a new way to see how “hot” or “cold” a particular financial instrument is. Typically a trader looks at such information in an instant, by way of a historical price chart. Market Meter adds dynamism to this analysis, since it illustrates over the amount of time you choose the “coldness” or “hotness” of a given ticker symbol.
To use Market Meter, just enter a ticker symbol and click the Go button. You can adjust for Sensitivity, how many days you want to go back in time, and what color scheme to use. (A surprising number of men are color blind, so we’ve even provided a color scheme for them!)

You can also enter two or three ticker symbols. Just punch them in separated by spaces or commas, and voila, you get three simultaneously animated meters!

Just more evidence that Slope is, bar none, the coolest financial site on the Internet. I hope you benefit from this new feature.

