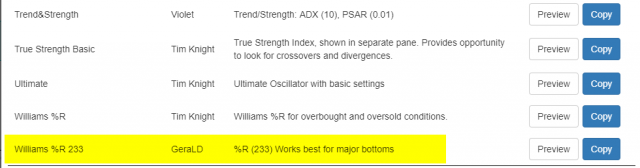
Now that shared technical study sets are live (read about them here if you haven’t already), I was eager to see if – – well, frankly – – they were at all useful. So I jumped in to look around, and one of the newly-available sets caught my eye:
Slope initially began as a blog, so this is where most of the website’s content resides. Here we have tens of thousands of posts dating back over a decade. These are listed in reverse chronological order. Click on any category icon below to see posts tagged with that particular subject, or click on a word in the category cloud on the right side of the screen for more specific choices.
As I mentioned in my post of August 5, volatility ramped up on July 26 and it continues to churn in US markets, as evidenced on the following daily chart of the SPX, as well as the monthly chart of the SPX:VIX ratio.
Near-term resistance and support levels are 2950 and 2800, respectively, on the SPX.
Major resistance and support levels on the SPX:VIX ratio are 200 and 100, respectively.
(more…)