One of my favorite unique features of SlopeCharts is its huge economic database. This has data goes back literally hundreds of years, and it has fascinating information from all around the world. For a history buff like myself, it’s especially fun to explore.
However, what’s always bugged me is that we were using this crazy symbols, and when you got the chart, the symbol would be your only indication of what you were looking at. And, let’s face it, these symbols don’t exactly burst off the screen with information.
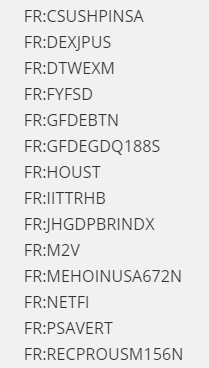
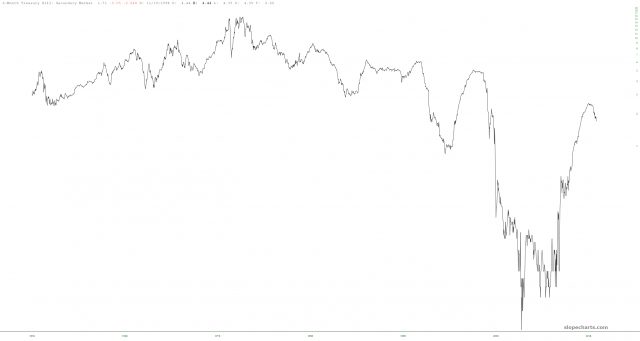
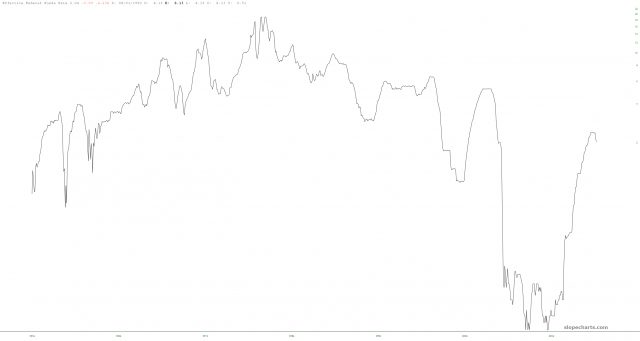
Now we give you the full description on the chart itself, because you might as well know what you’re looking at.

Thus, here are a few economic charts I just pulled I thought you’d find interesting. Click on any one for a much bigger version.
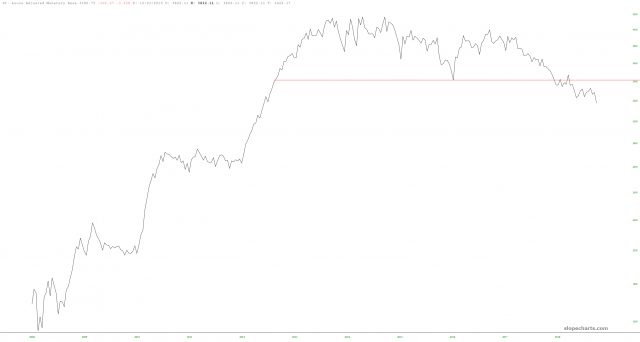
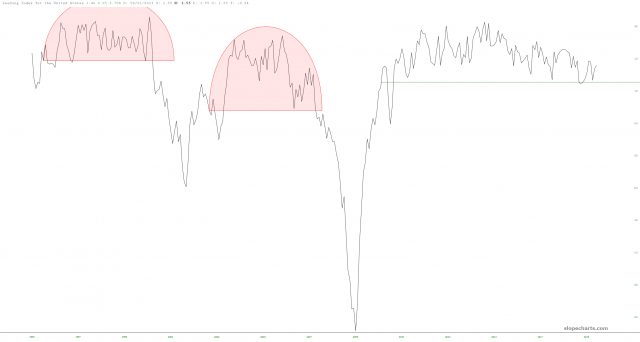
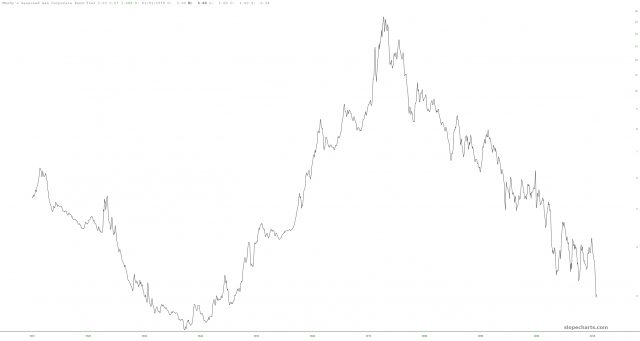
As a reminder, Diamond members get exclusive access to this economic database. If you want to give the Diamond membership a try, please click here.

