One of the advantages of being a microscopic company is the ability to move with extraordinary speed and precision. You, as the user, are the beneficiary. I have some news for you SlopeCharts users to illustrate this point. Observe this new item in the Appearance tab (accessed via the Preferences dialog box, which you get to by clicking the gear icon):

A few hours ago, this didn’t exist. Now it does. The reason was born out of a frustration on my part. As I am going through trading ideas, I look at the entire set of data, which typically goes back a decade or two, if not more. I am looking at these charts on an enormous screen, but even so, I can’t tell where the present price is relative to the chart as a whole. I have to load the chart and zoom in every single time to get a sense as to the present price position. This is boring, time-consuming, and tedious.
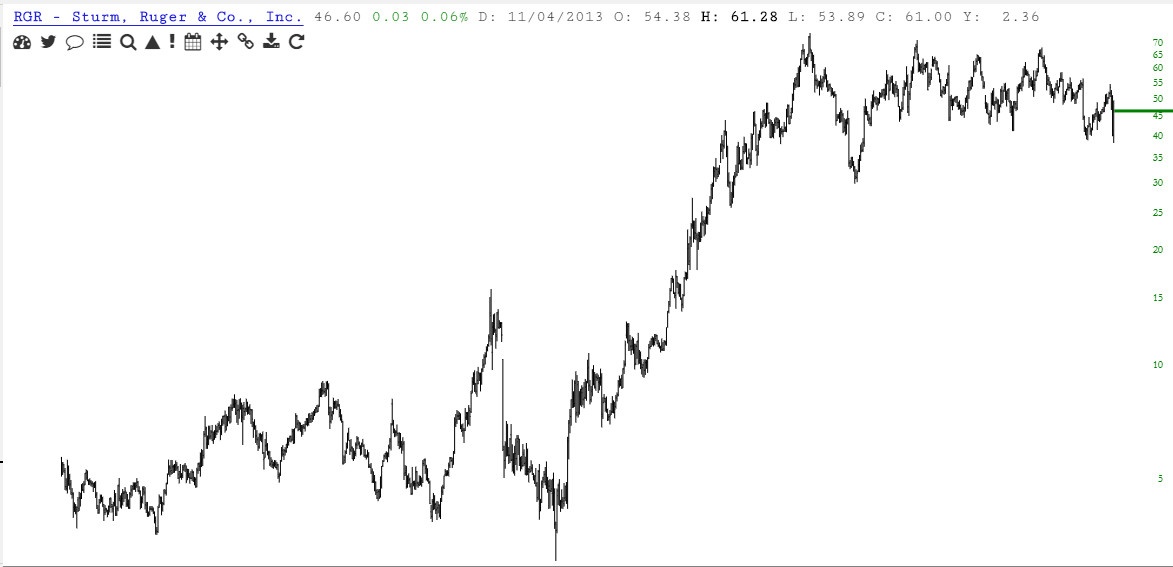
Thus, in the wee hours this morning, we added this new feature. If you have this preference checked, a long line (green if the price is up, red if down) will stretch from the present day’s bar to the right edge of the program.
We have set this choice to “Off” by default, since it would otherwise confuse people, but I wanted you to know it is available for immediate use (be sure to refresh your SlopeCharts in your browser for the latest version).