I’ve got a couple of improvements to SlopeCharts to mention.
First of all, intraday SlopeCharts now work with Macintosh. That may seem like an odd thing to announce, but, frankly, they’ve never worked on a Mac until now, so I wanted the handful of Mac users out there to know we got this bug fixed! You will kindly take note of the Apple logo in the upper left corner:
The other, more general, news is that we’ve introduced another technical indicator, the Price Percentage Oscillator, to our suite of studies.
The Price Percentage Oscillator (PPO for short) is extremely similar to the Moving Average Convergence Divergence (MACD) study except in one respect: whereas the MACD displays the absolute difference in price between the 12-day and 26-day exponential moving averages, the PPO expresses this difference in percentage terms. In other words, whatever the percentage is of the spread between the two moving averages versus the slow moving average.
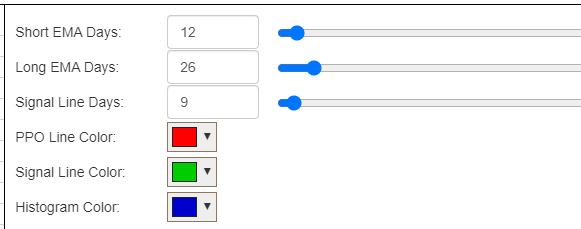
When you select the PPO from the technical studies, these are the controls offered to you, with the default values filled in automatically
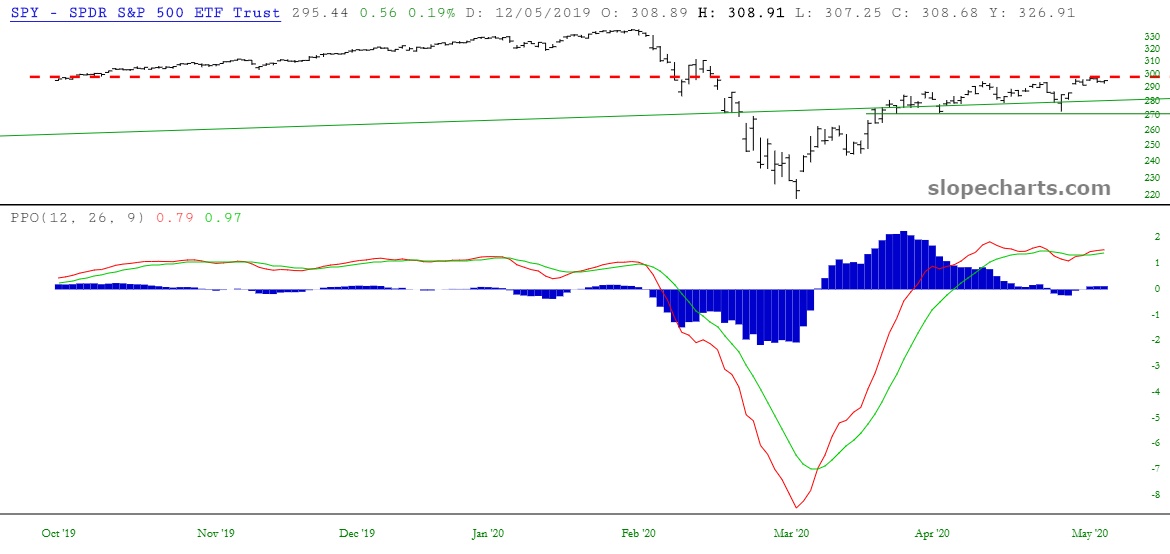
If you look at a chart with the PPO and MACD simultaneously, they will see almost indistinguishable.
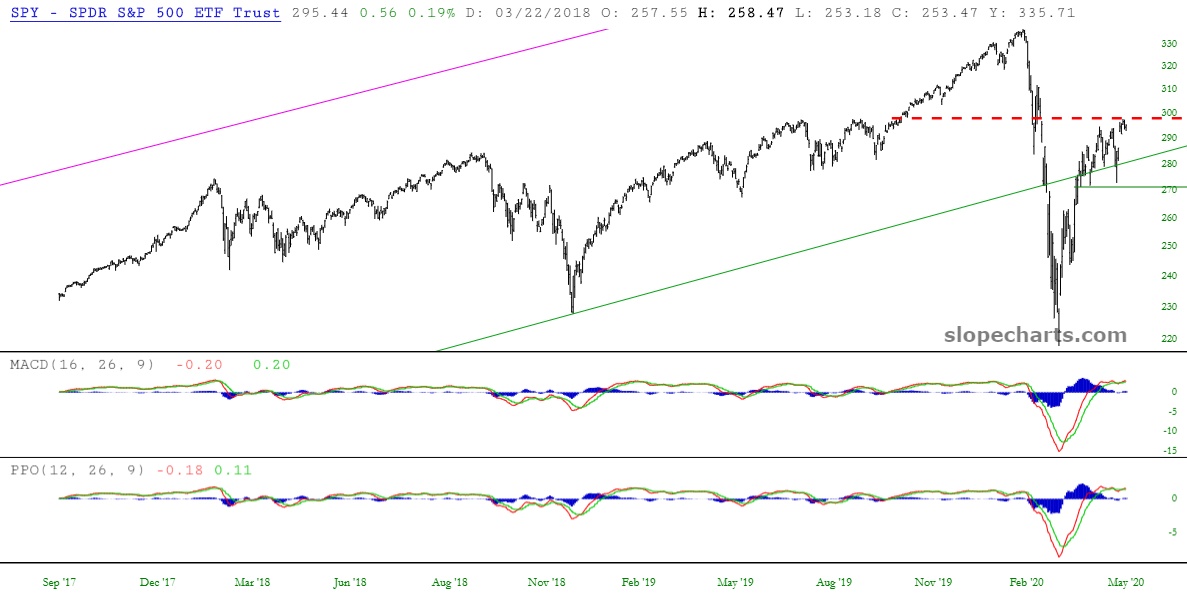
The values on the scale, however, are totally different. And, on occasion, the crossover points will differ slightly between the two studies. Generally speaking, however, the indicators and their interpretation are identical.
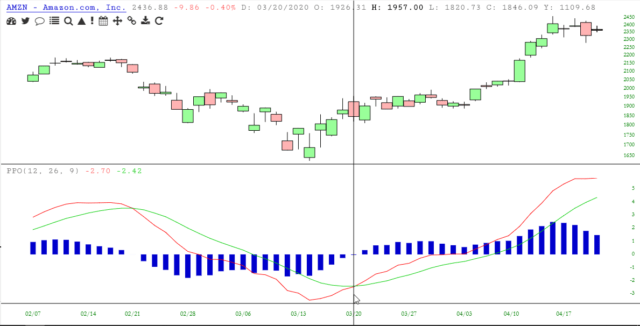
Here is a simple example of the PPO in action. Below is a chart of Amazon in the year 2020. A vertical line has been placed at the point of the crossing beneath of the signal line, indicating a selling opportunity.
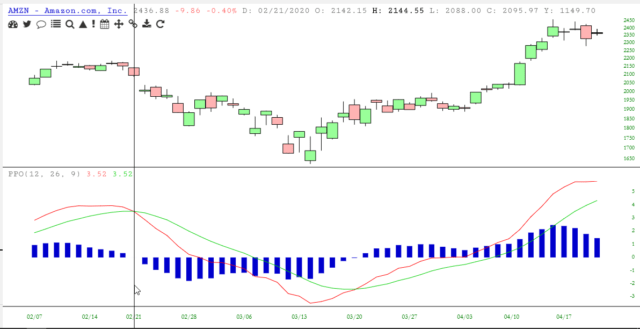
A little over a month later, the indicator crossed the signal line in the other direction, indicating a buying opportunity. In both cases, a significant dollar change took place which was favorable to the trader positioned short (in the first chart) and then long (in the second).