My tweet near day’s end sums up my feelings nicely:
Let’s look at some indexes; I’ve put some remarks beneath each.
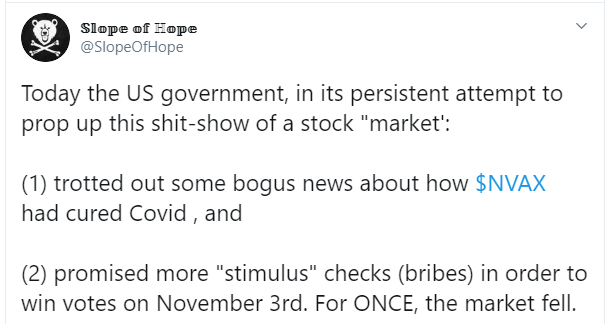
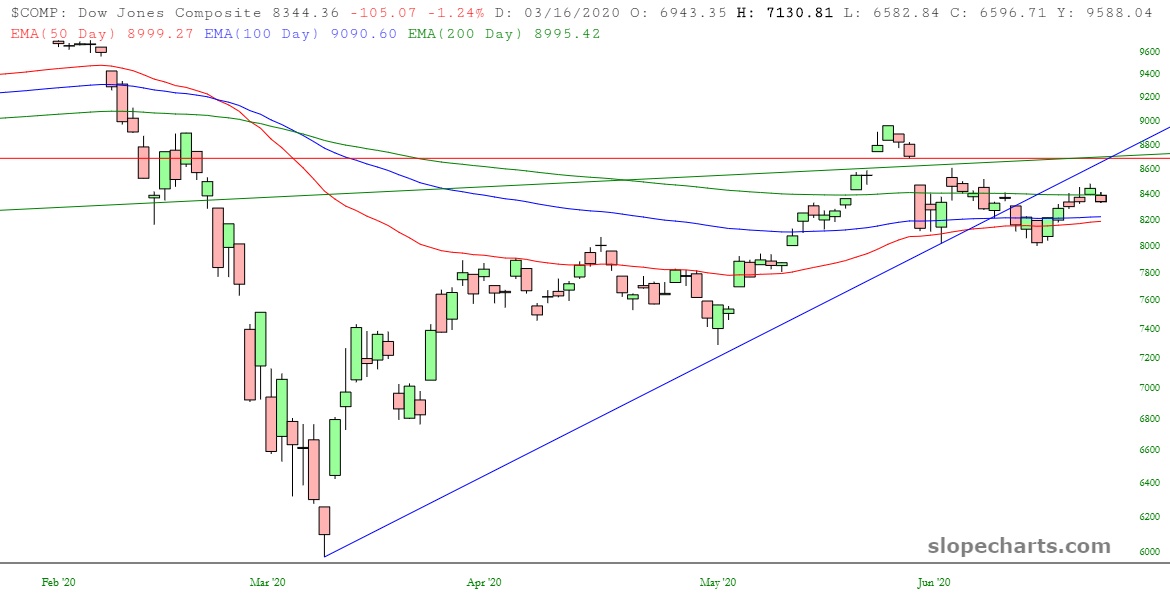
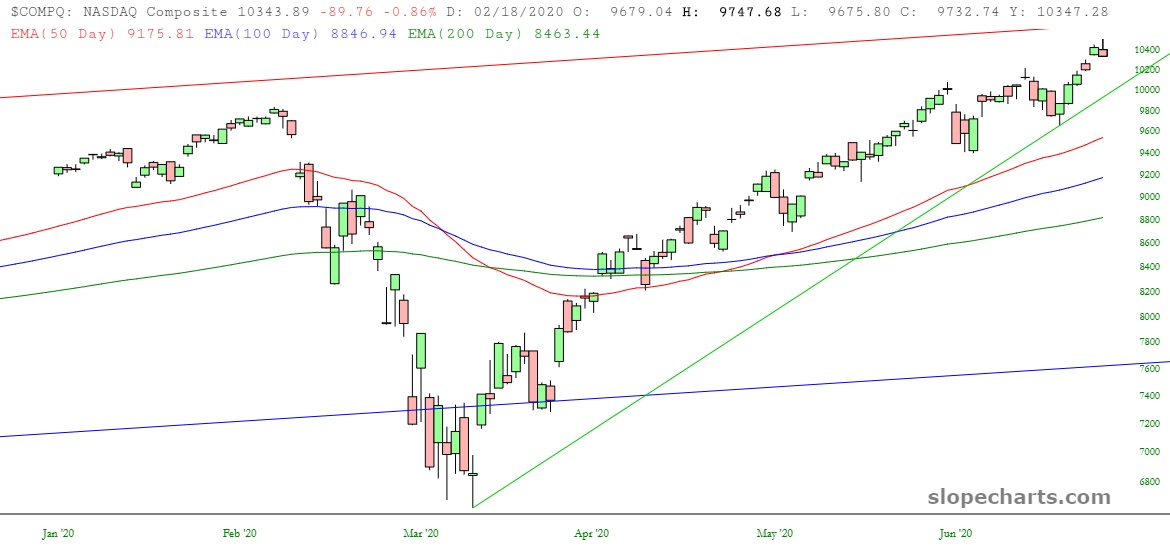
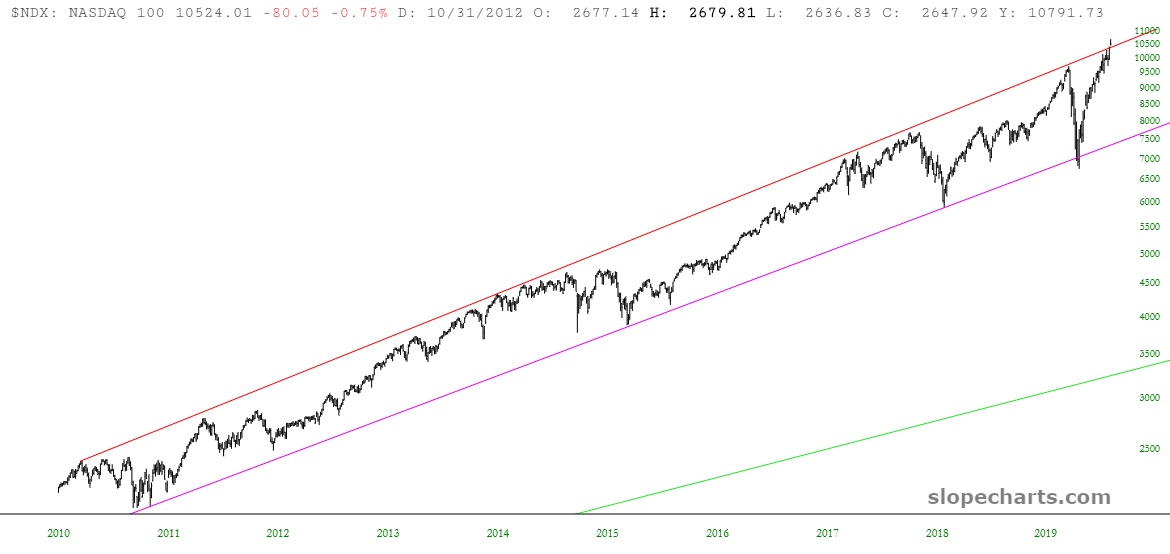
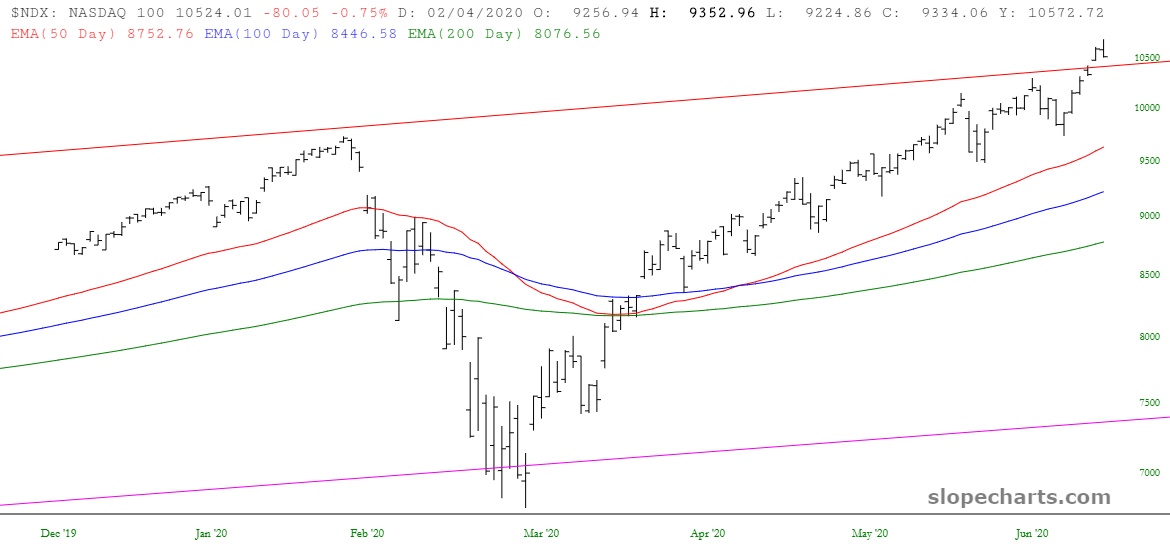
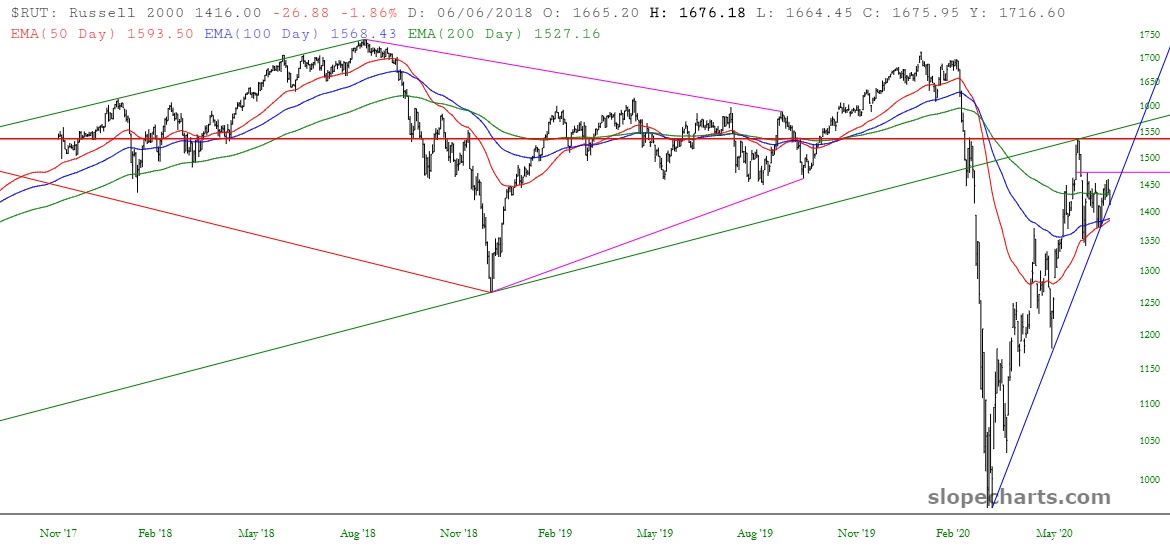
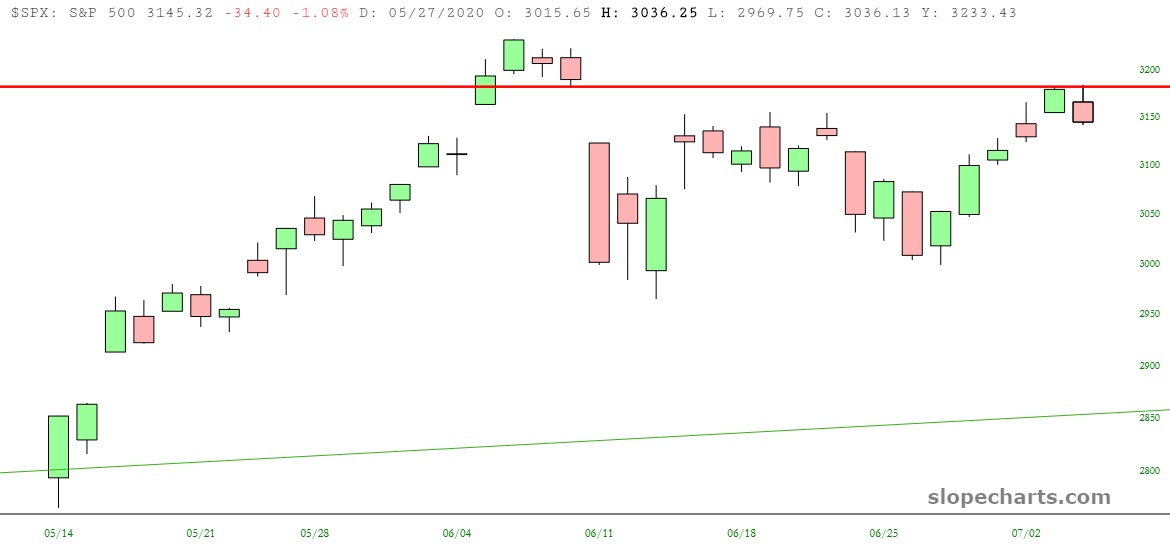
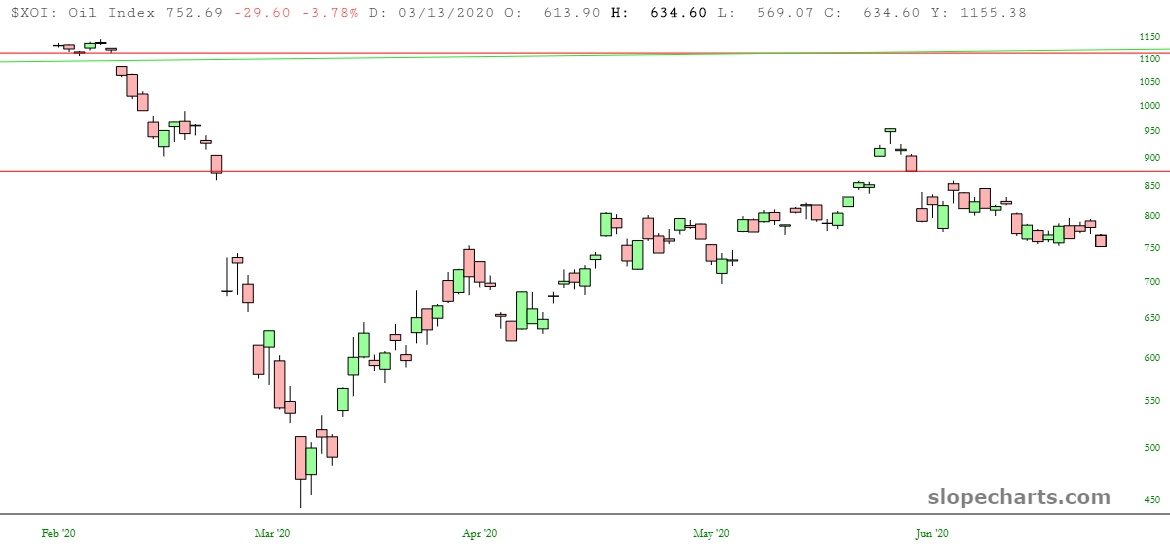
Dow Composite – still below the price gap, still below the broken intermediate term trendline, and no bullish crossovers. All good things.NASDAQ Composite – obviously a bullish paradise. Lifetime highs on the megacaps virtually every day. Bullish crossover took place months ago. This one will be the last to go.Gold Bugs Index – zoom! Great stuff, and poised for sailing higher.NASDAQ 100 – This is a long-term chart spanning about a dozen years. You can see present price levels are mashed right up against the highest trendline.NASDAQ 100 closer view – the rally has been so strong we’ve actually slipped past the grasp of the trendline’s resistance, similar to how we broke below support (briefly) in March.Russell 2000 – always of the most interest to me personally, we are right at the cusp of a potential trendline failureRussell 2000 closer – notice how the moving averages remain bearishly configured and how we are just pixels away from a trend breakS&P 500 with an absolutely picture-perfect gap closureOil and Gas Index – a beautiful island reversal pattern, and weak ever since
Currently I have 70 short positions, 173% commitment level, and all 70 profitable.