
In my premarket video this morning at theartofchart.net this morning I was looking at the very attractive looking setup on the index futures for a sharp retracement, and since then an H&S has broken down that would look for the 4165 area on ES. That would be a backtest of the daily middle band as support, and as I was explaining looking at the ES chart particularly, this retracement may well go deeper towards the 4100 area.
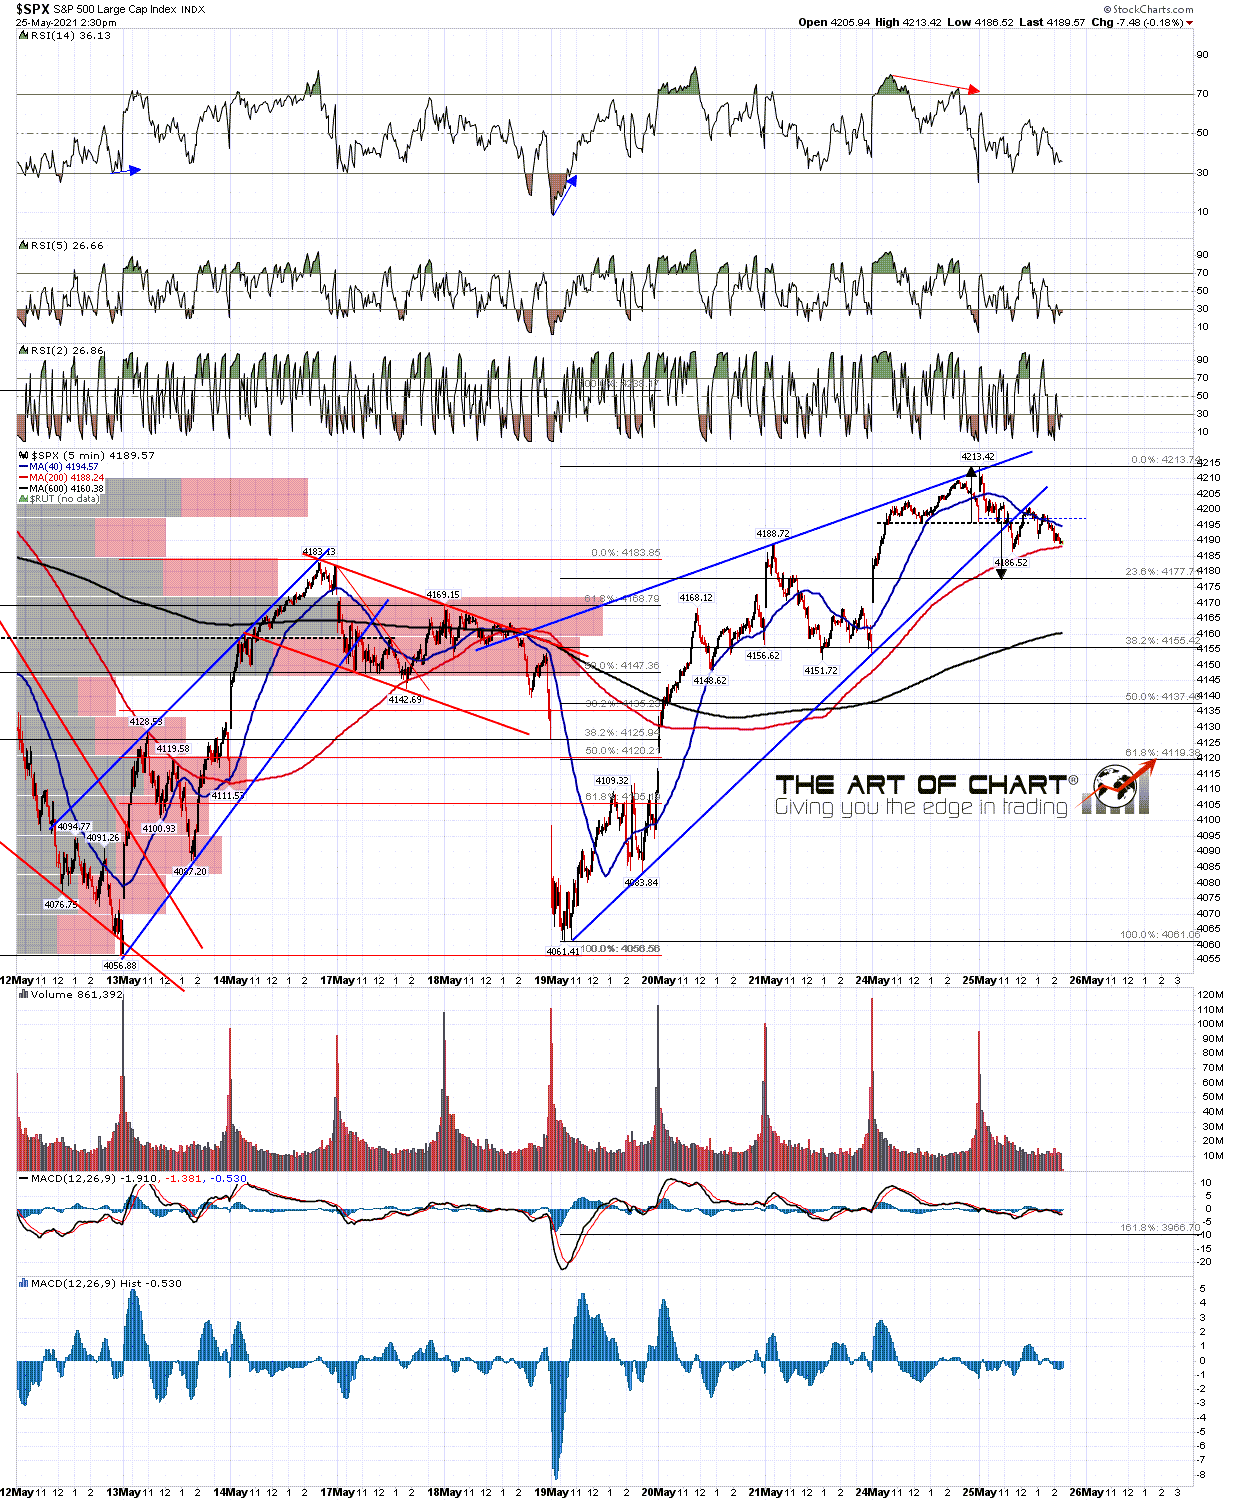
On the SPX 5min chart the current move has formed a high quality small rising wedge that has broken down and backtested broken support. A small H&S has broken down looking for the 4177-80 area. That would be only a 23.6% retracement which would be unusually modest. Generally I would be looking for the 4120 – 4155 area in the 38.2% – 61.8% retracement range.
SPX 5min chart:
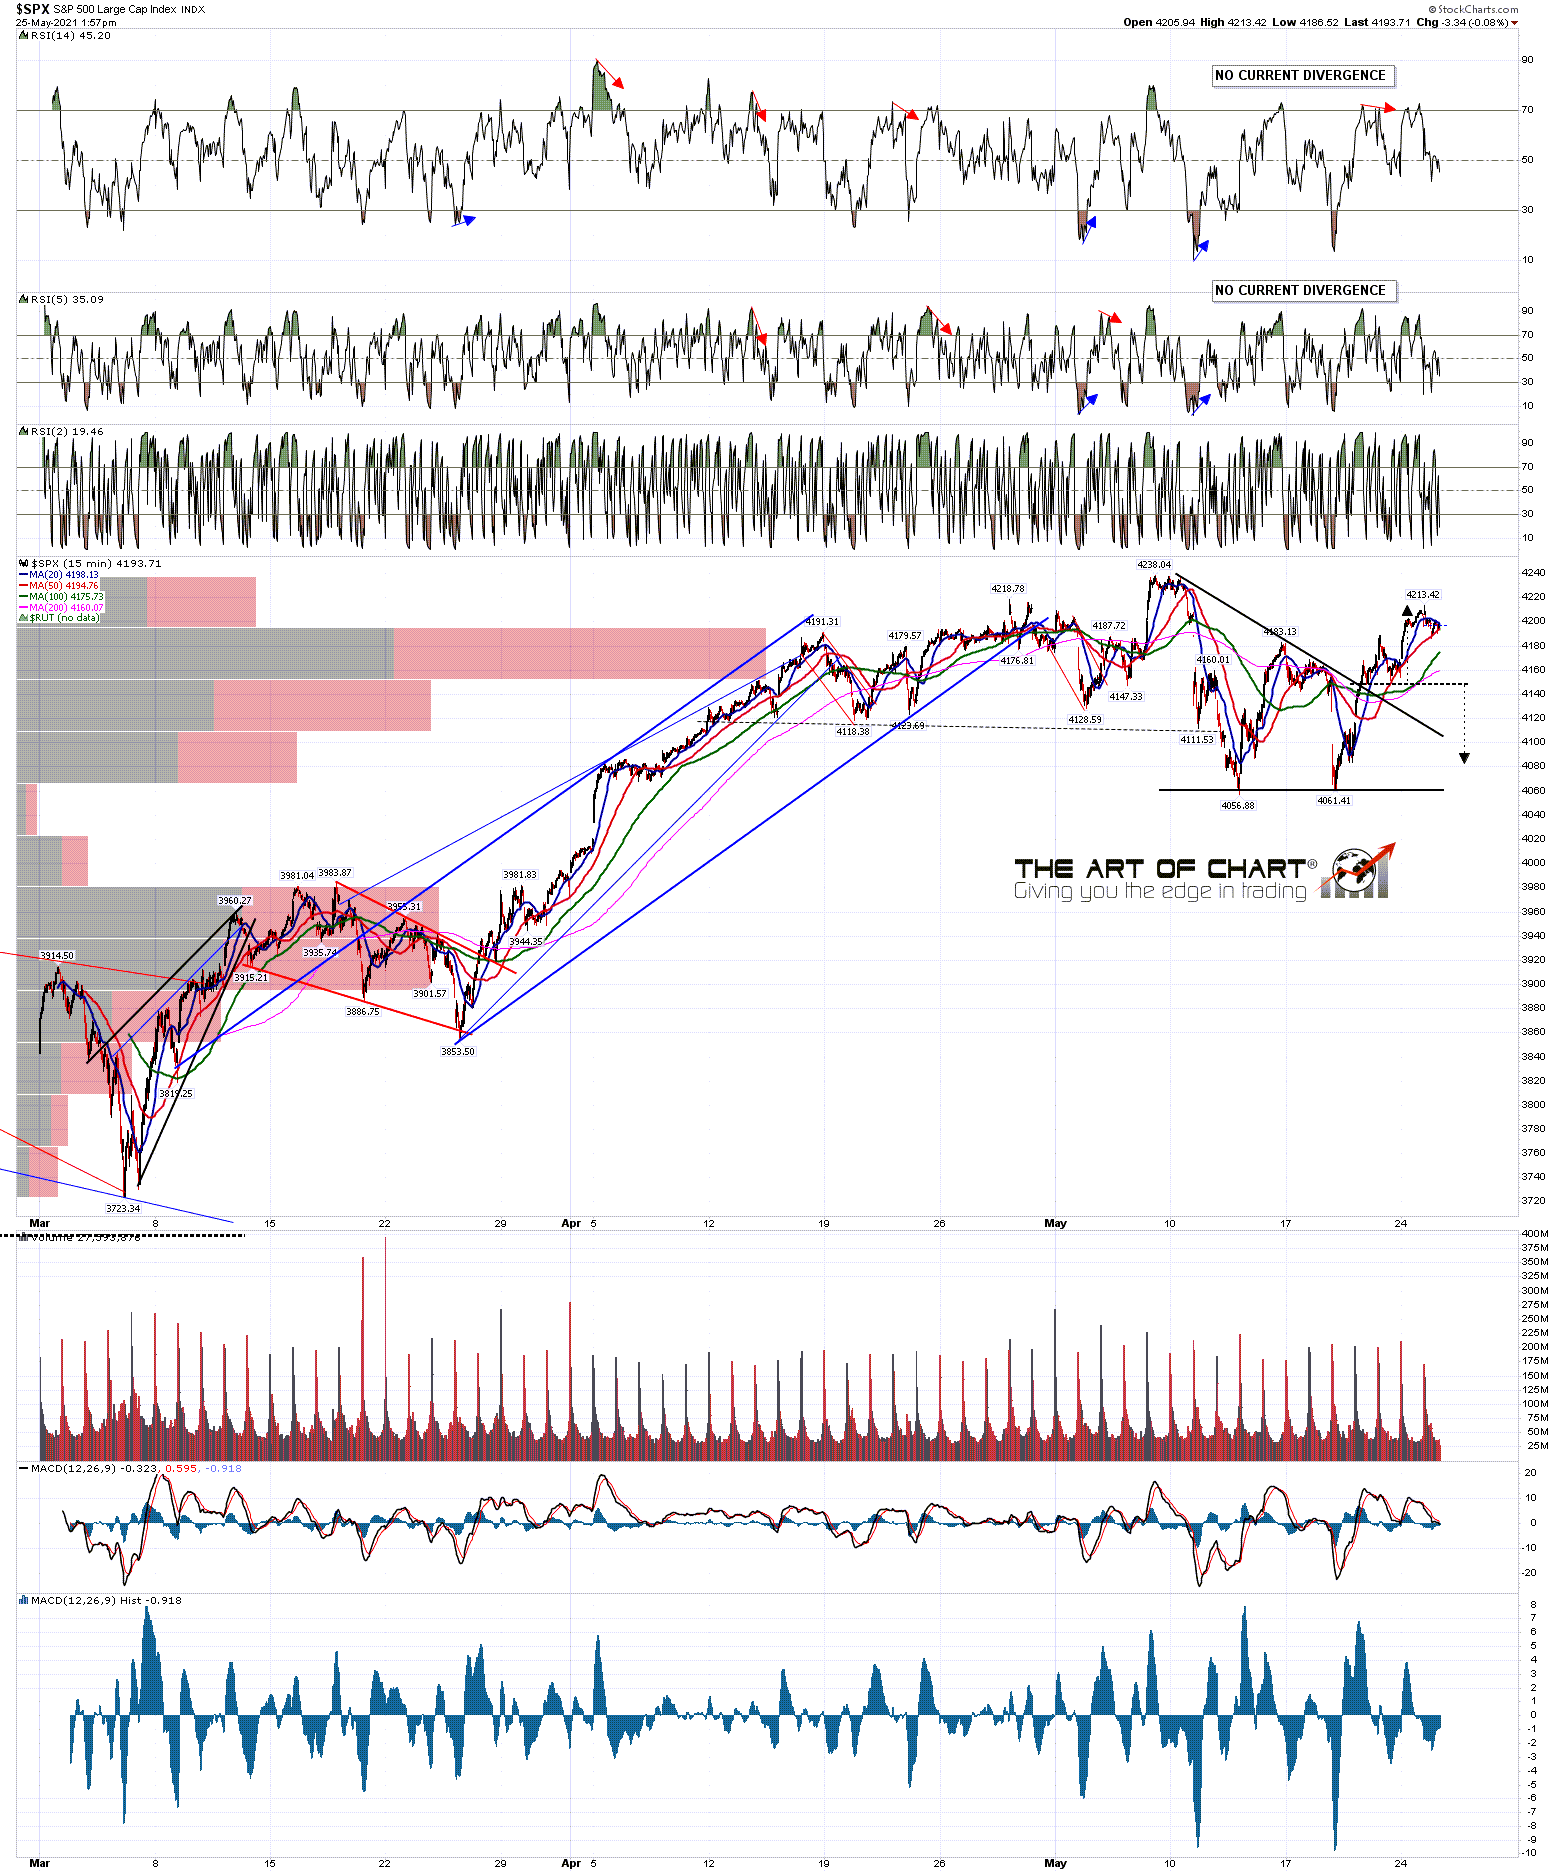
On the bigger picture this current move is a break up from a triangle. Ideally we would see a backtest back into the body of the triangle, ideally in the 4100 area, though the move does not need to go that deep. The pattern on ES is suggesting that may be the target area though.
SPX 15min chart:
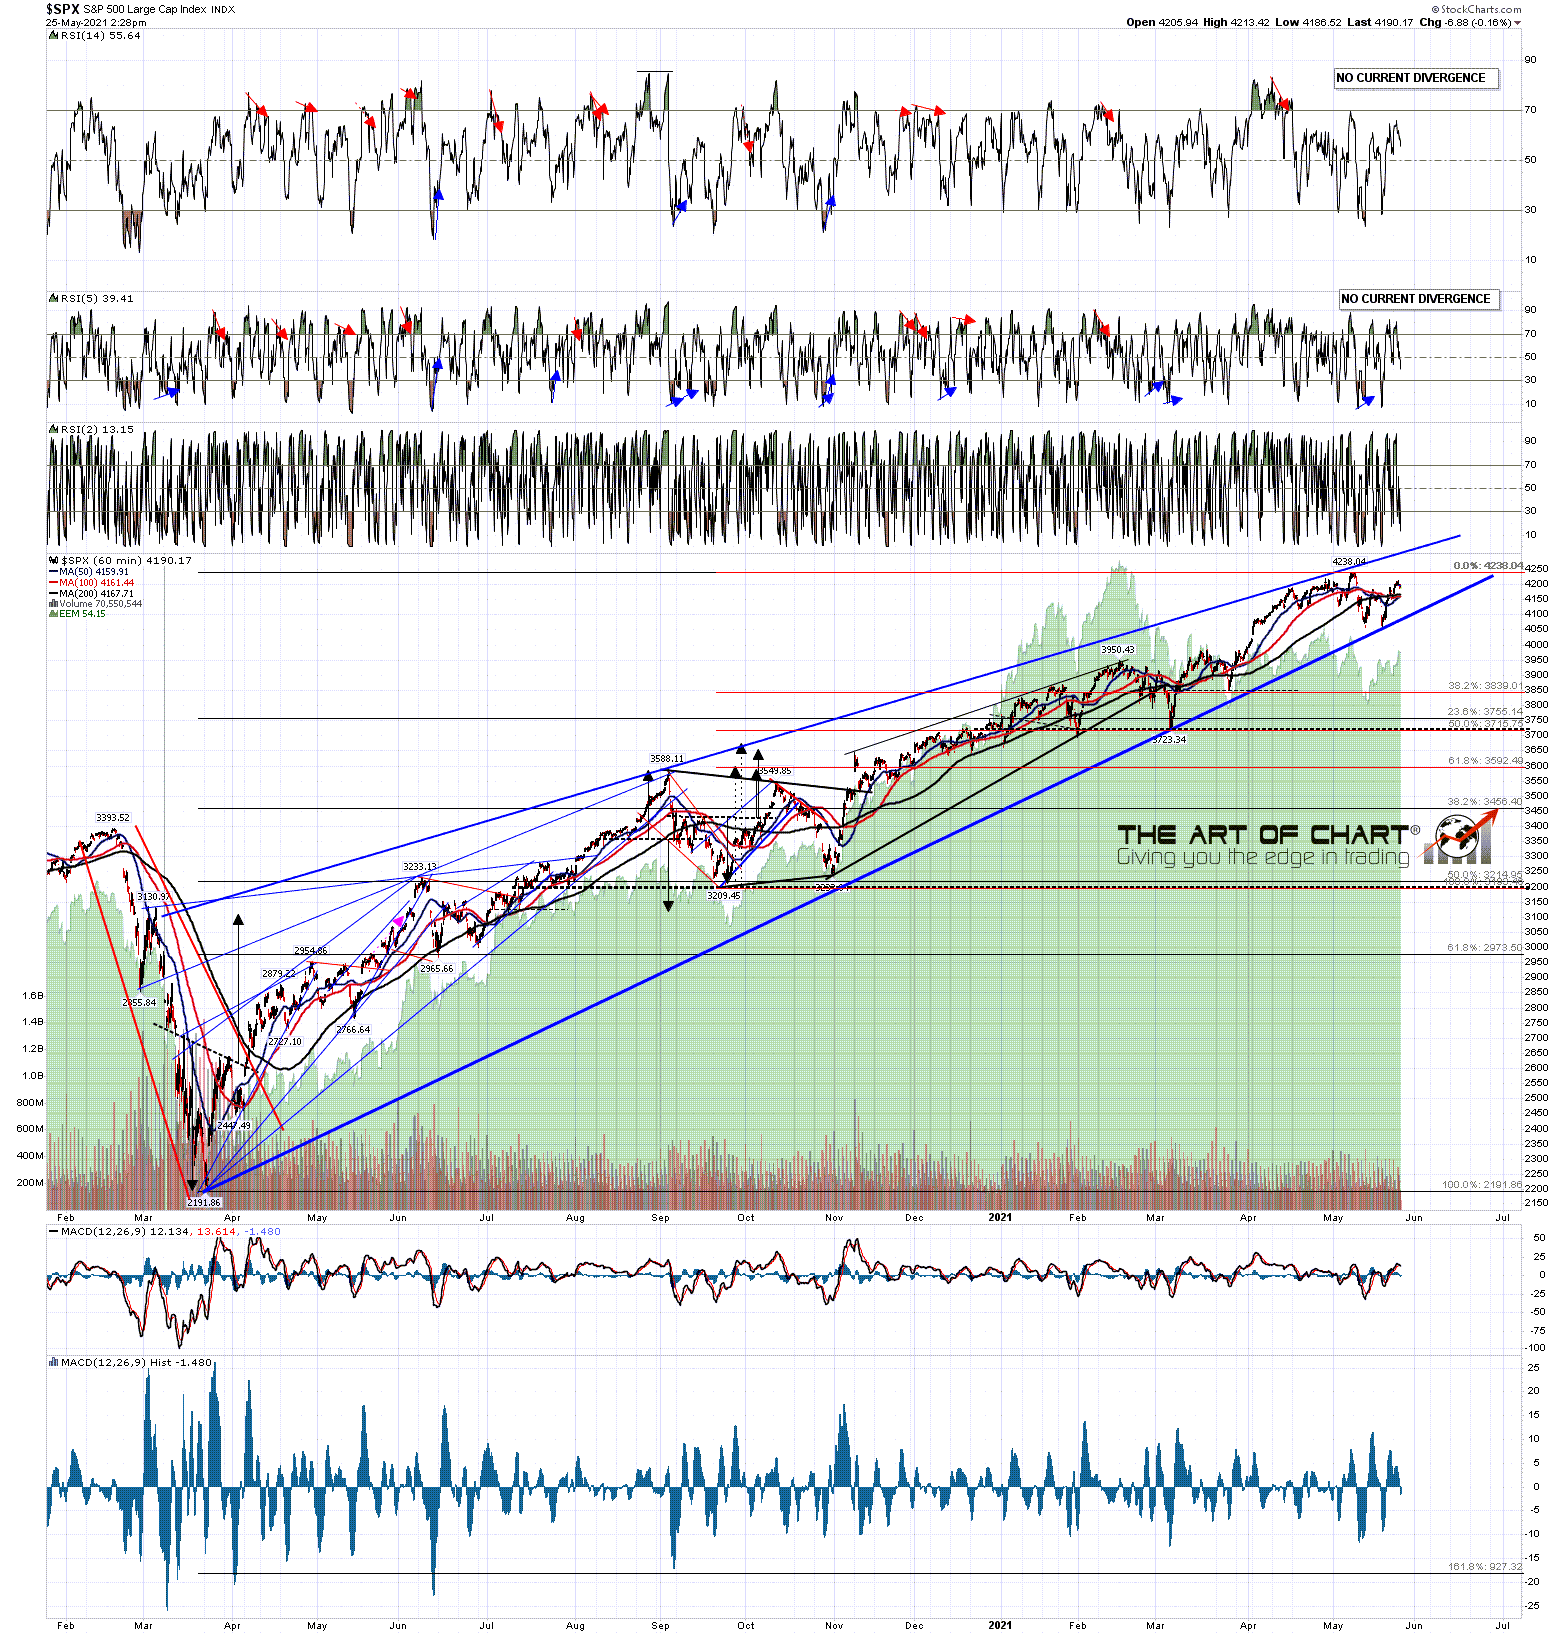
On the rising wedge from the March 2020 low any retracement would need to hold wedge support, currently in the 4070 area, and the obvious next target within the wedge would be the wedge resistance trendline just under 4300.
SPX 60min chart:
On the daily chart for SPX, as well as NDX and INDU, there are open daily RSI 14 sell signals that I’m expecting to make target after this current move up has played out, and daily middle band support at 4167 will have to be broken and converted if the retracement target is lower than that. Support at the hourly 50MA is in the same area, so that is an strong level.
SPX daily chart:
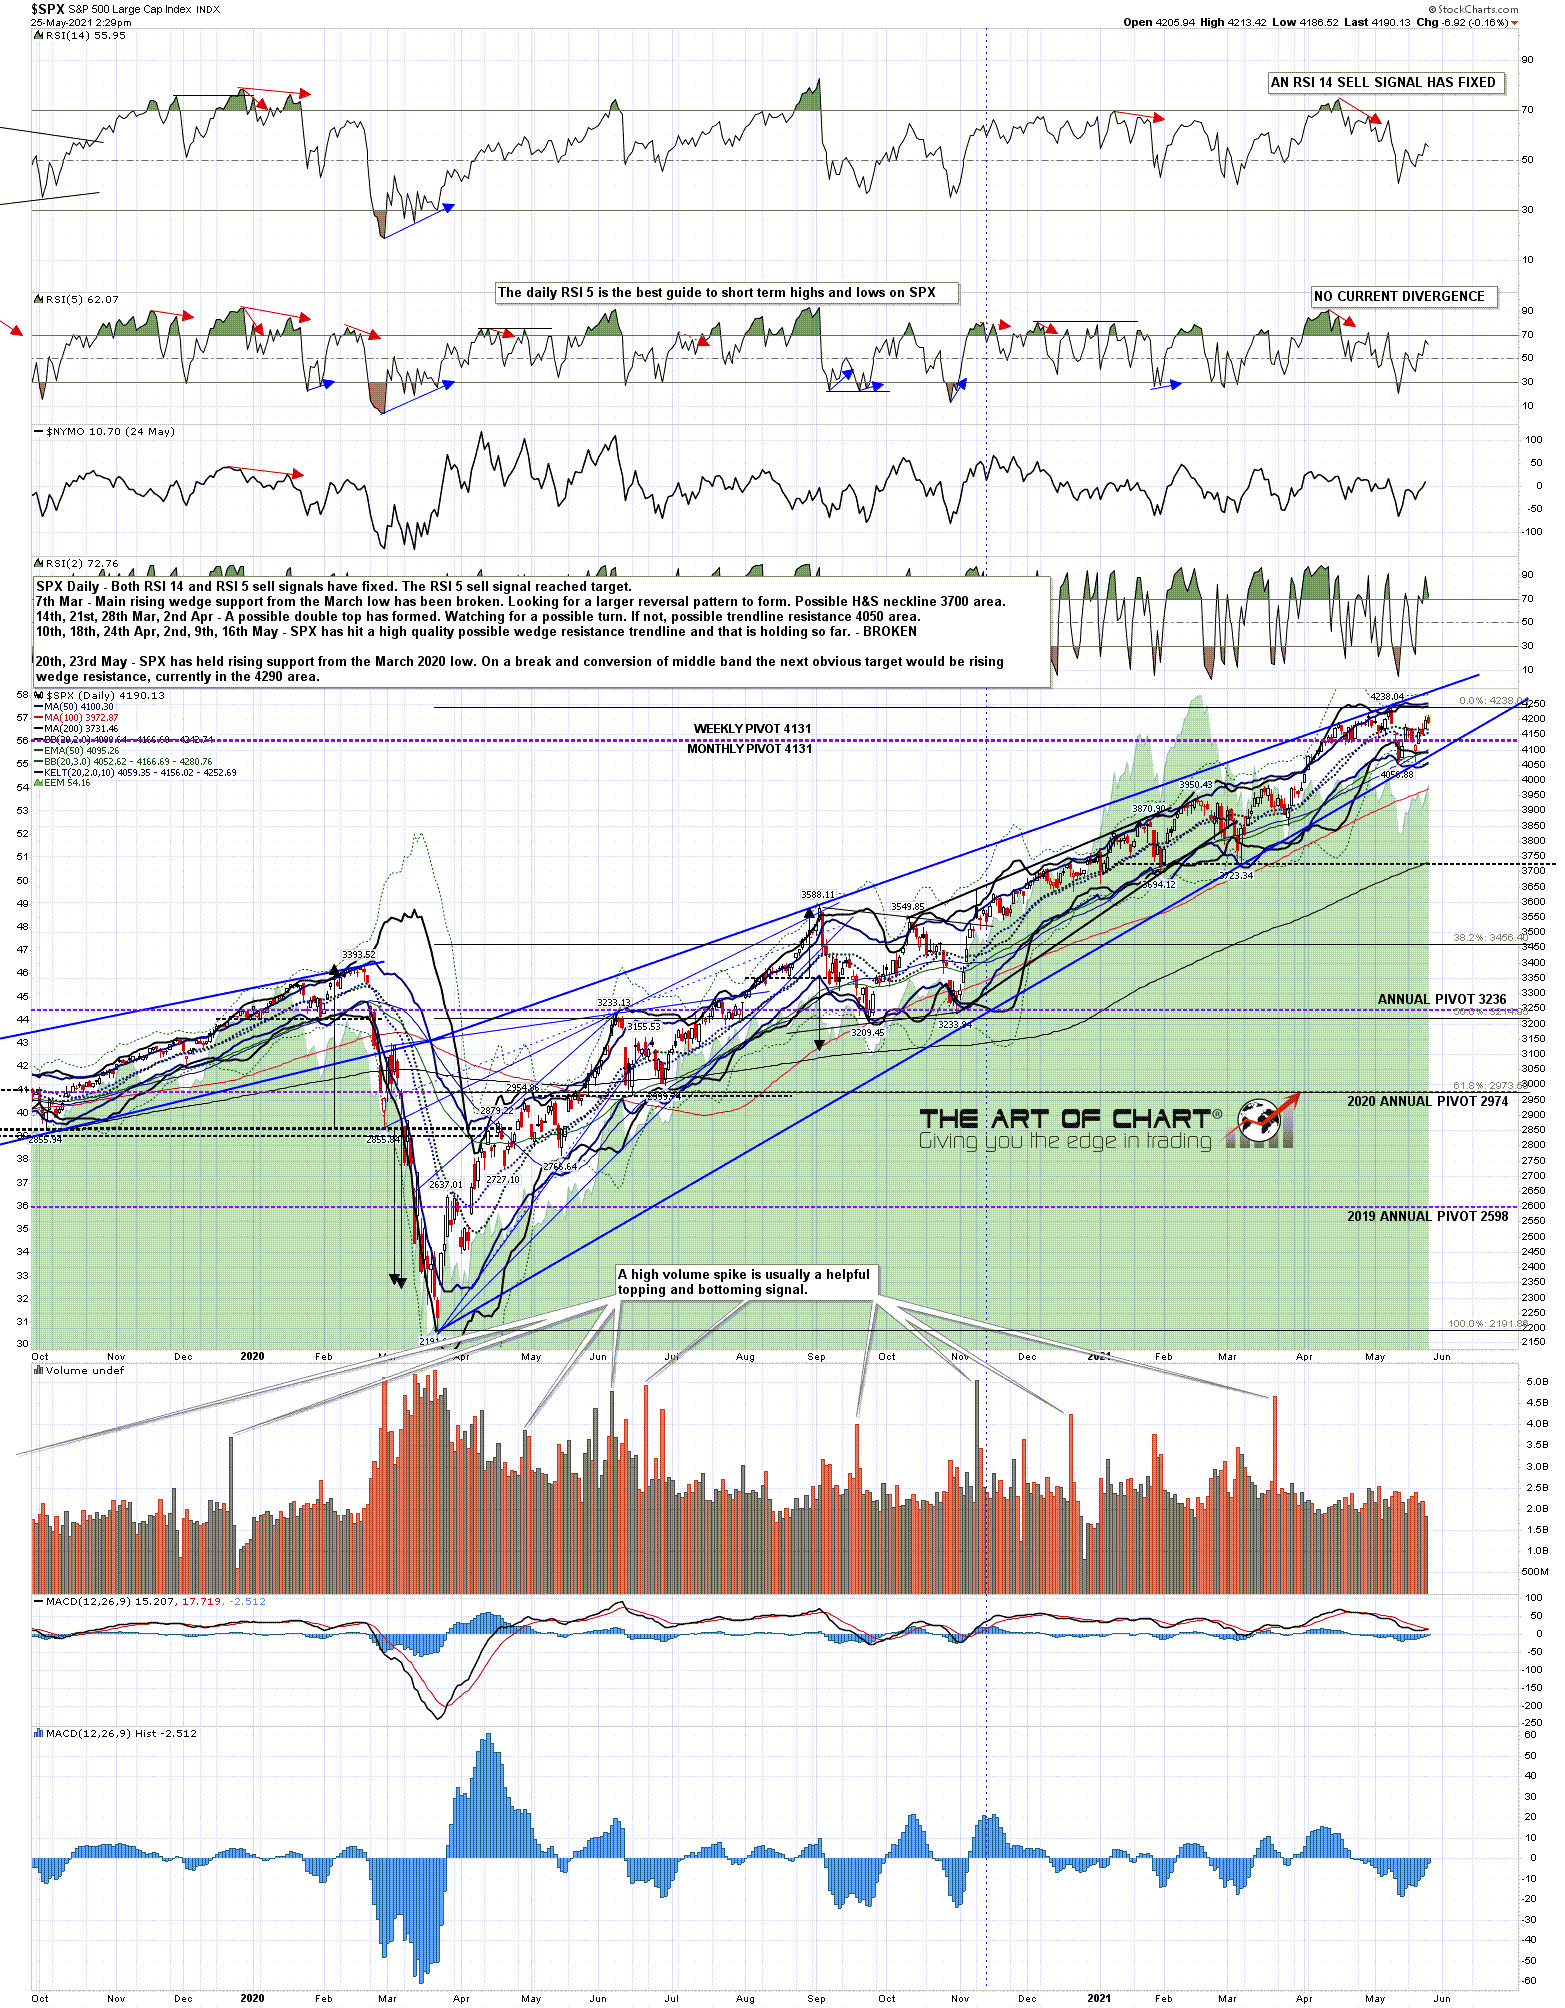
If seen, a decent retracement here is likely setting up a run to retest the all time high on SPX and then very possibly to run up into rising wedge resistance just currently under 4300. If seen I’ll be looking for resistance there.
