
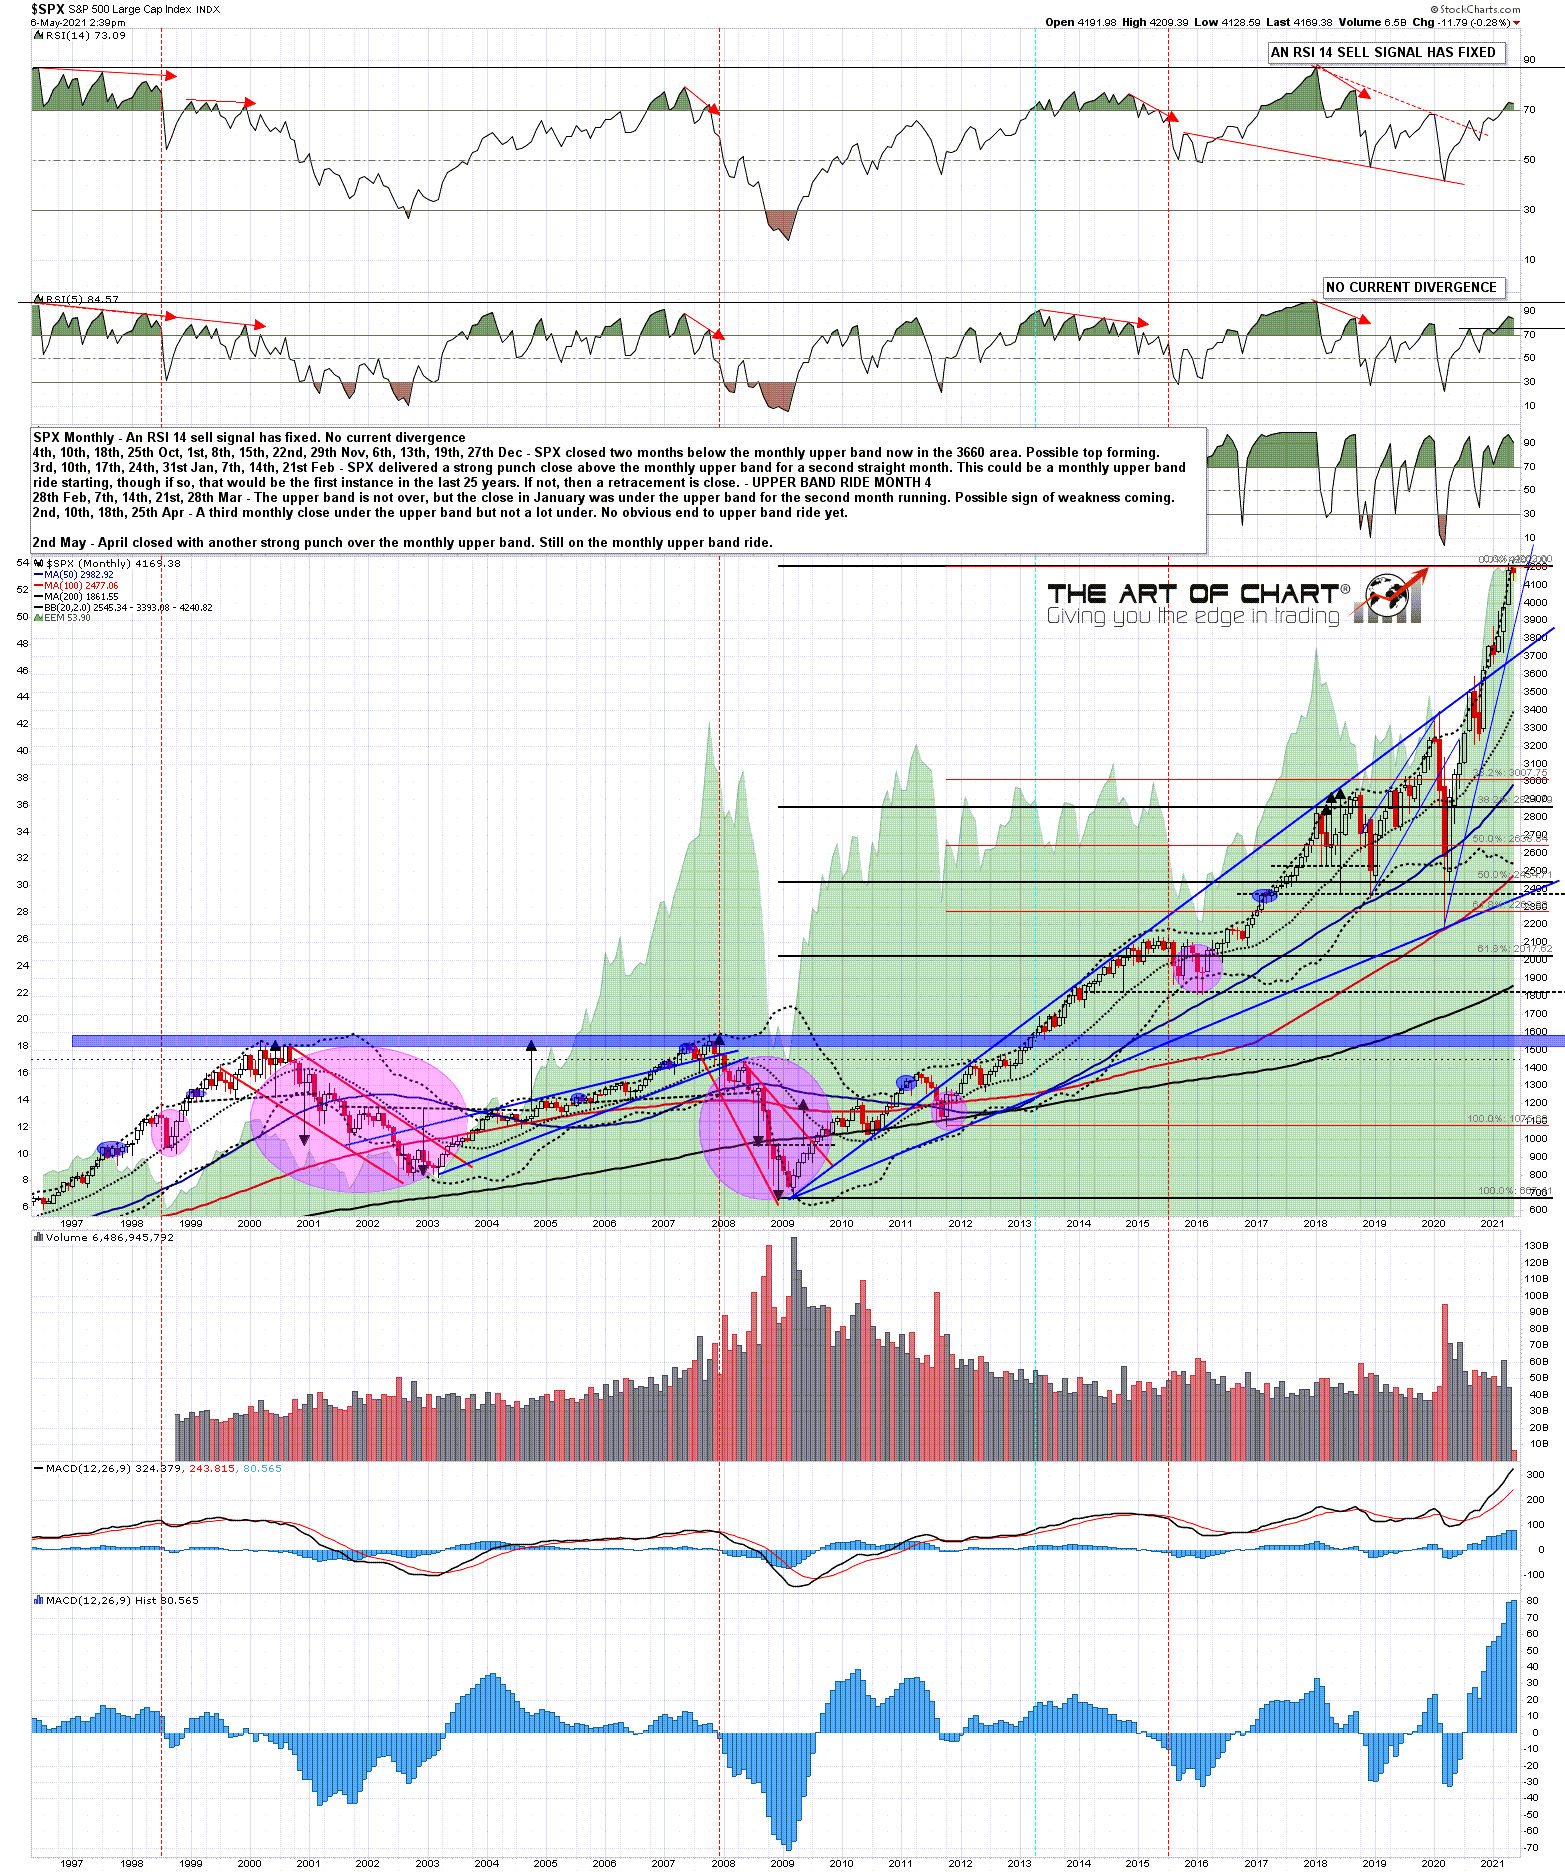
On the bigger picture here the overall position on SPX is bullish. There has been a solid break over the big resistance level at 4000, and SPX is currently on both monthly and weekly upper band rides. There is currently no negative divergence on either of the monthly or weekly charts, with the weekly RSI 5 sell signal that had fixed having failed.
SPX monthly chart:
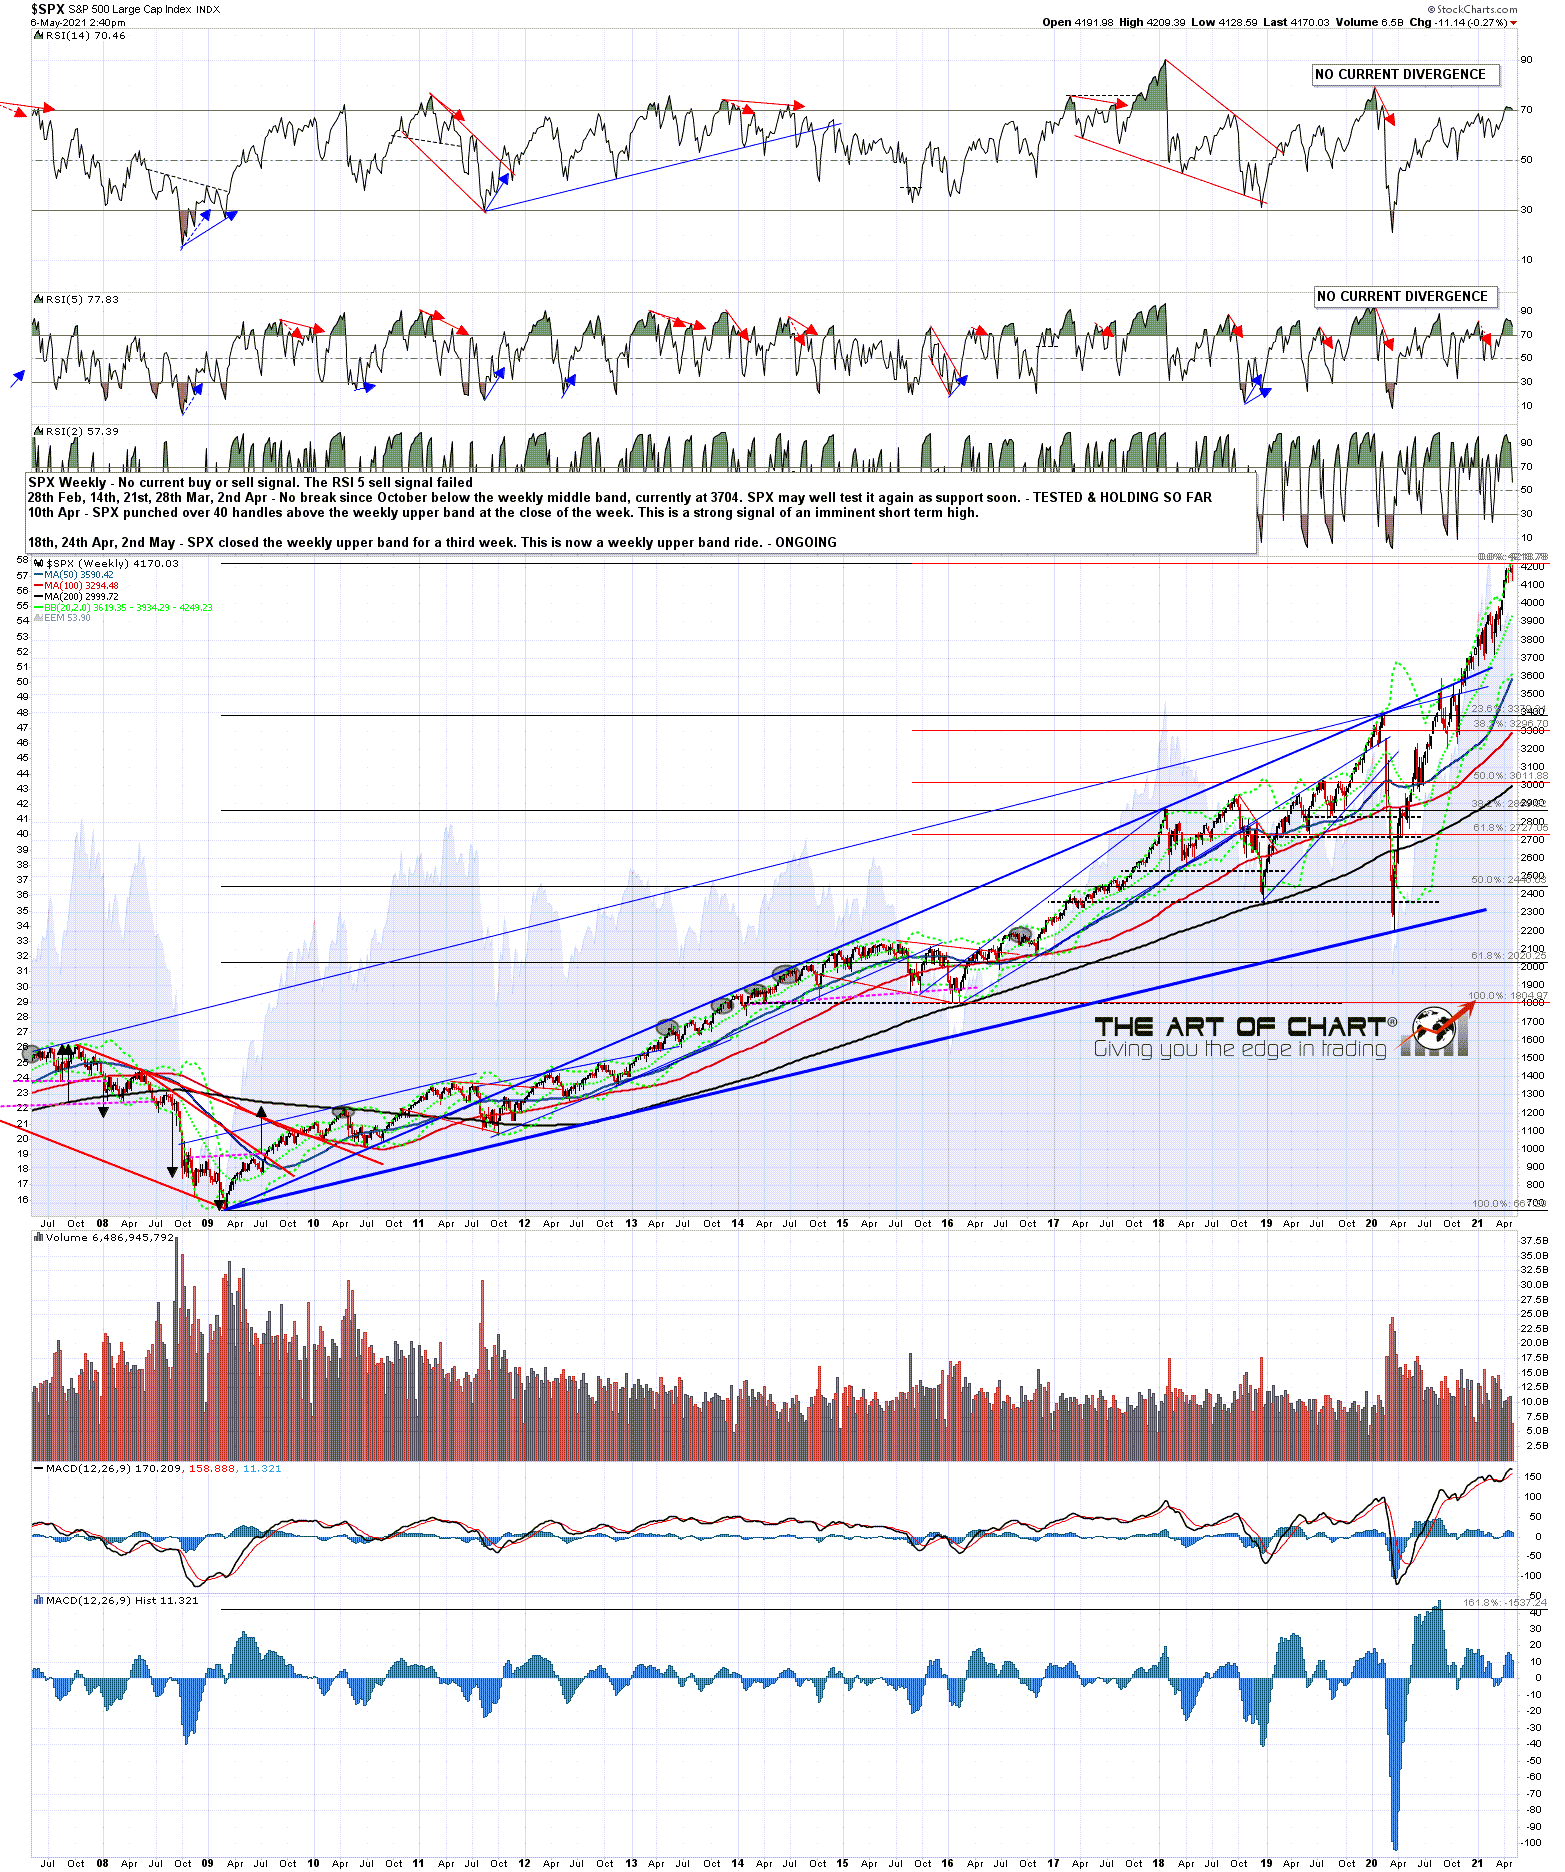
The last serious retracement found support at the weekly middle band and that is now at 3934 and rising. Until that breaks and converts to resistance there’s not a lot happening on the bear side.
SPX weekly chart:
However, after a break over a big resistance level there is very often a backtest, and the setup for that has been shaping up nicely. Both RSI 14 and RSI 5 daily sell signals have now fixed on SPX and the setup here is favoring topping patterns forming to deliver that backtest. Ideally that would be into the 3950 – 4025 range. Any lower would be a possible main support break.
This week there have been two tests of the daily middle band that have held on a daily close basis so far. That’s now at 4166 and needs to break on a daily close basis to open the downside.
SPX daily chart:

In terms of topping patterns there is a promising looking possible H&S forming and on a sustained break below the monthly pivot at 4131 the H&S target would be in the 4025 area. That is a very real contender unless SPX breaks and converts the weekly pivot at 4192 to support, in which case I’d expect to see a high retest. There’s a very decent looking H&S setup on RUT/IWM as well, and a possible large double top on NDX.
SPX 60min chart:
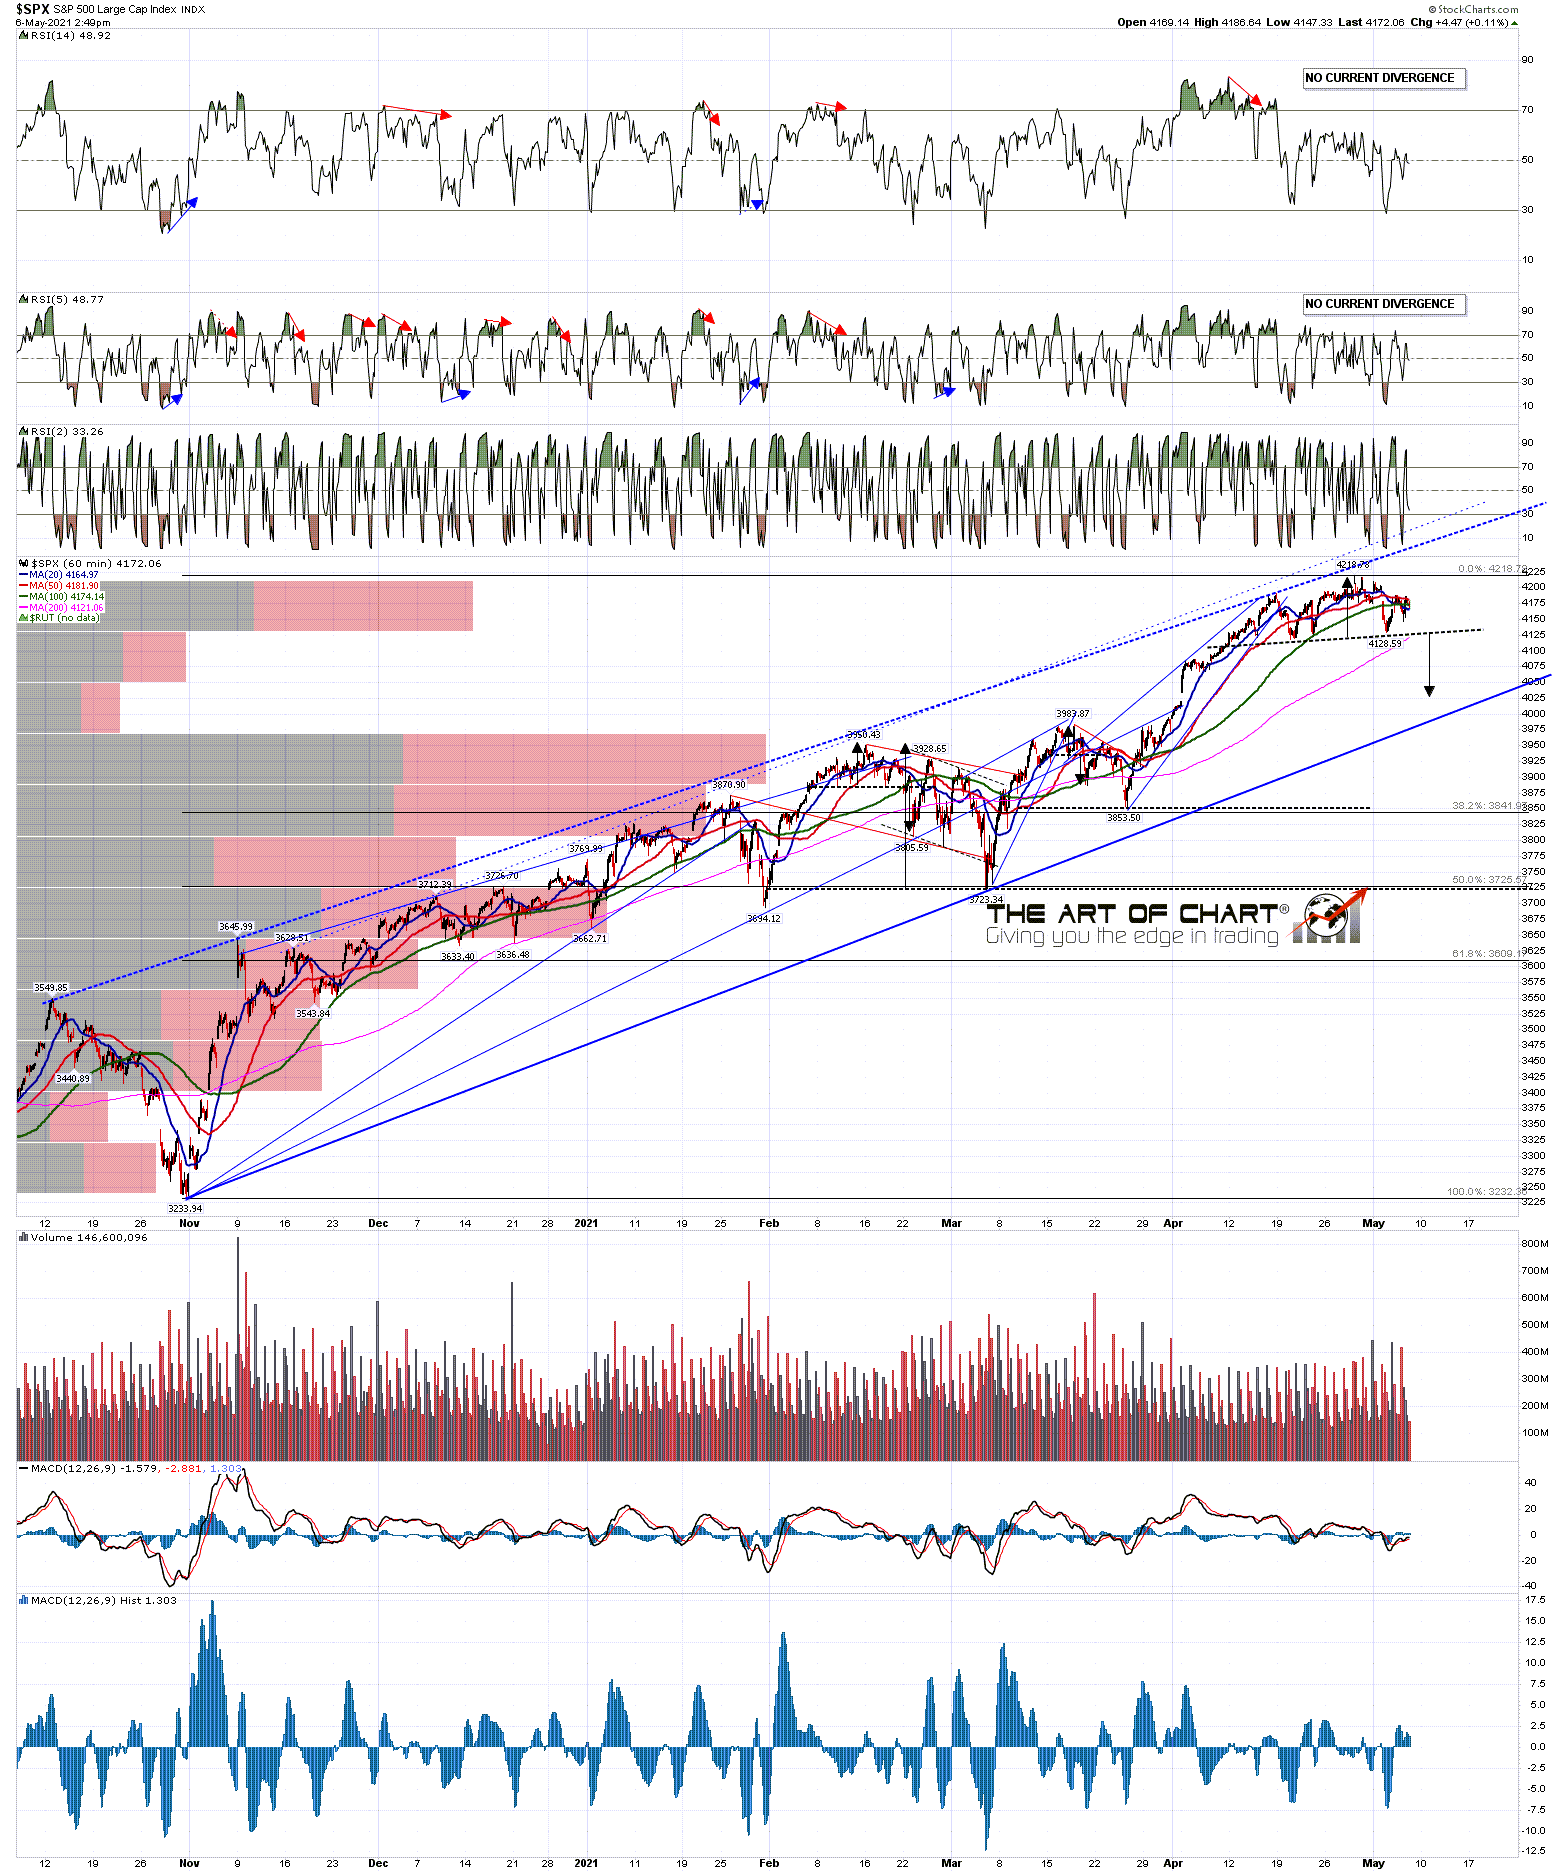
There may not be a high retest though, as the last outstanding upside target on the indices was reached yesterday when the Dow triangle made target at a retest of the high there. That means that there is now also a possible RSI 14 sell signal brewing on Dow.
I’ve done two intraday webinars for subscribers at theartofchart.net this week looking at this Dow triangle and calling the next likely market moves on SPX with it. That’s interesting from a pattern perspective and if you’d like to see those those from Tuesday and yesterday the links are here and here respectively.
INDU 15min chart:

Stan and I are doing our monthly free public Chart Chat at theartofchart.net on Sunday. If you’d like to attend the link to register for that is here. The link can also be found on our May Free Webinars page.
