As a reminder to those of you interested in cryptocurrencies, Slope has the best crypto charts around in SlopeCharts, the latest news, as well as real-time streaming crypto portfolios. And we’re working on more features.
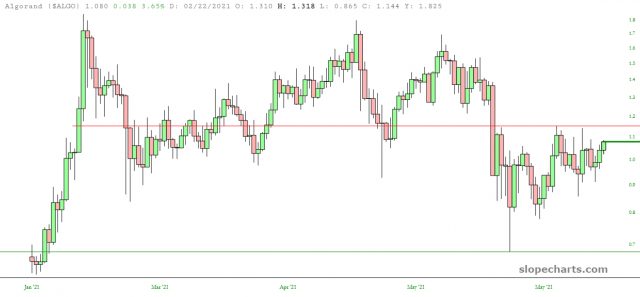
Yesterday, Sunday, I decided to re-enter my two favorite crypto charts, Algorand ($ALGO) and Cosmos ($ATOM). What we’re facing now is a key decision point. Looking at the short-term ALGO chart, we need to push past the red horizontal. If we can do that, we’ve got an excellent chance for a truly substantial move higher. It’s the range into which we’ve been boxed (everywhere!) that matters.
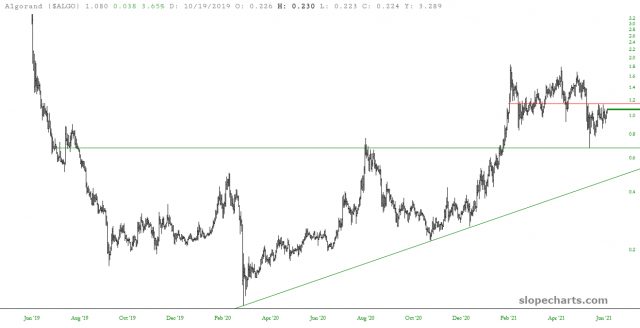
Here is the longer-term ALGO chart. You can see the beautifully-formed inverted H&S pattern, whose size dwarfs (can I say that these days?) the overhead supply. There could be an absolutely massive rise in store if we can just conquer what’s above that red horizontal.
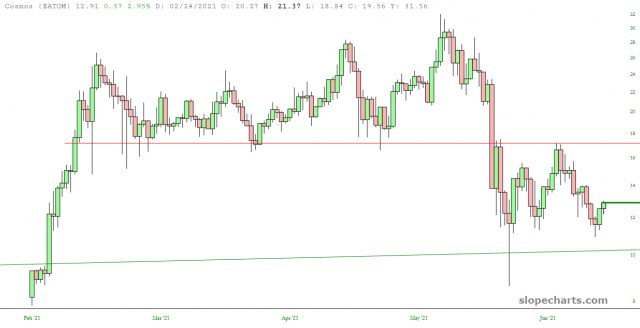
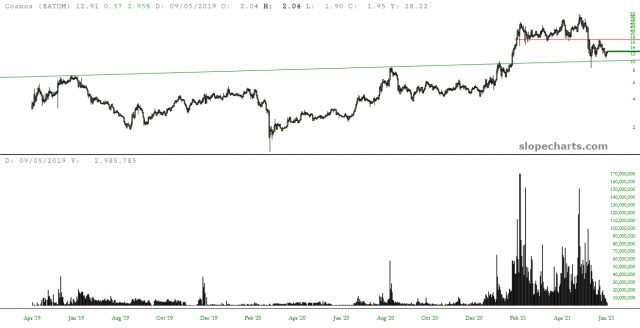
A similar situation is found with ATOM. You can see the range of the past few weeks plain as day.
In this longer-term ATOM chart, I highlight the volume, whose massive swelling is highly agreeable with the aforementioned IHS pattern. There is power behind this setup, people.
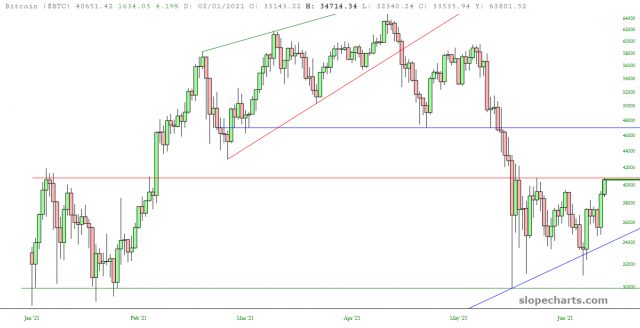
Of course, it’s all up to Bitcoin, which has been swatted back and forth for a month now, banging between a range of about $34k and $40k. There are two barriers, each represented by horizontal lines. The blue, higher line is more formidable, since it defines a clean H&S pattern. Beat that, and we could be in for a whole new phase of crypto ascendency.
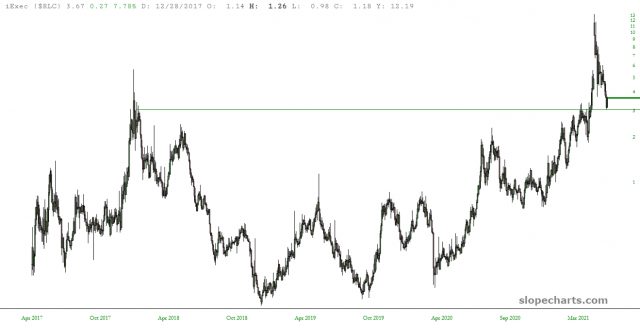
I would like to add a new, third entrant to my crypto portfolio, iExec ($RLC), which I bought earlier today.
