Preface to all ETF Posts: I am composing this on Thursday afternoon, so the charts will be up-to-date as of then. I wanted to make some general comments about specific ETF groupings, principally to give me a little time to not have to worry about creating new content for you good people in the near-term.
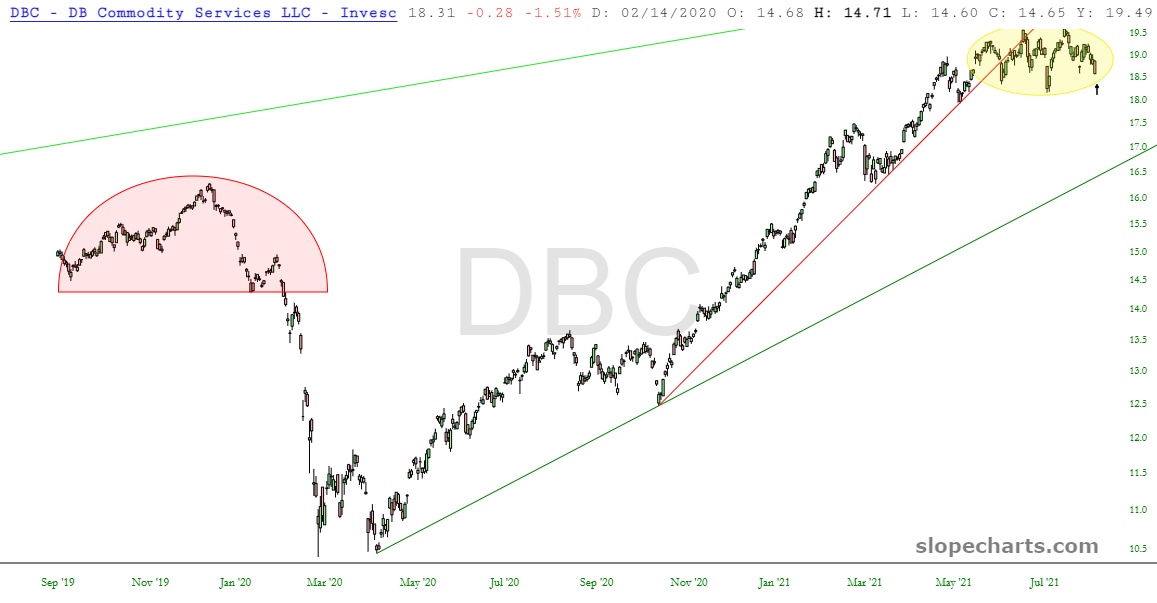
I’ve probably over-mentioned this, but energy is my favorite bearish sector. I’ll start off with the commodity fund, symbol DBC, which has completed a well-formed diamond pattern. These are rare (well-formed ones, at least) and important reversal signals.
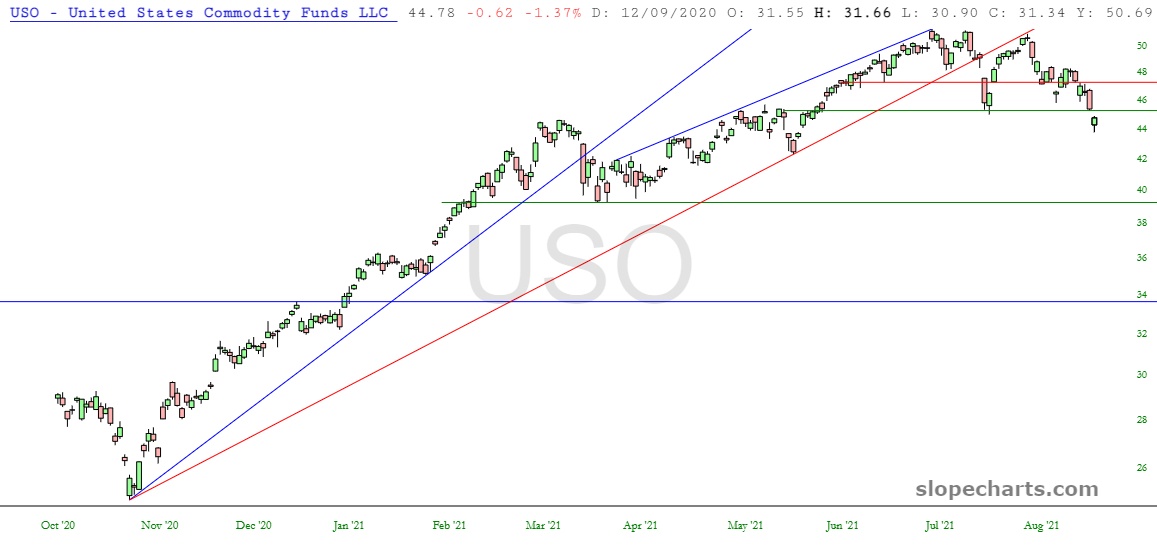
More specifically, energy has been breaking down for many weeks. First, it failed its ascending trendline that goes back almost ten months, and second, it double-topped and broke resistance with a gap-down on Thursday.
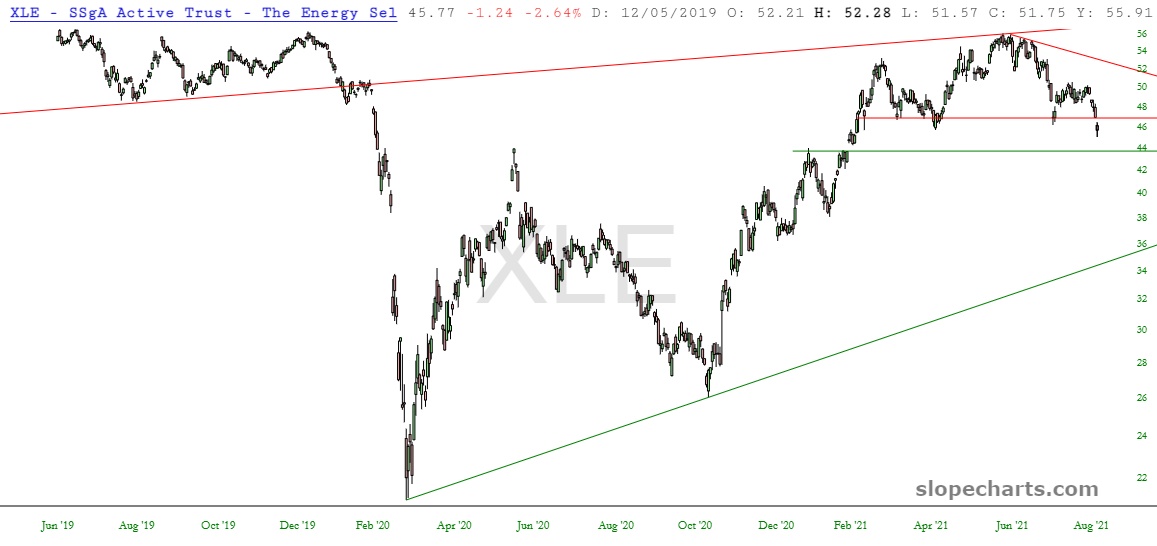
I have set myself up to benefit from this observation by way of October XLE puts, which is my largest position by far. This head and shoulders pattern is complete, and I think its major support is a long way from here, somewhere in the mid-30s.
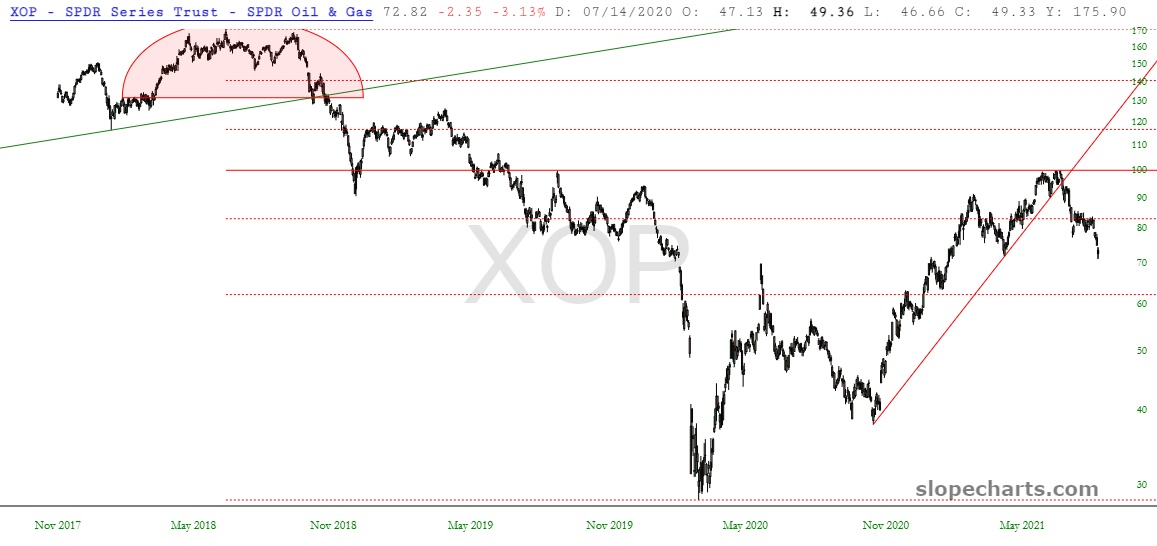
I found the XOP pattern choppier and less appealing, what I will say this: XOP’s ability to bounce up to its 50% Fibonacci resistance line perfectly and then turn tail was an eye-opener.