
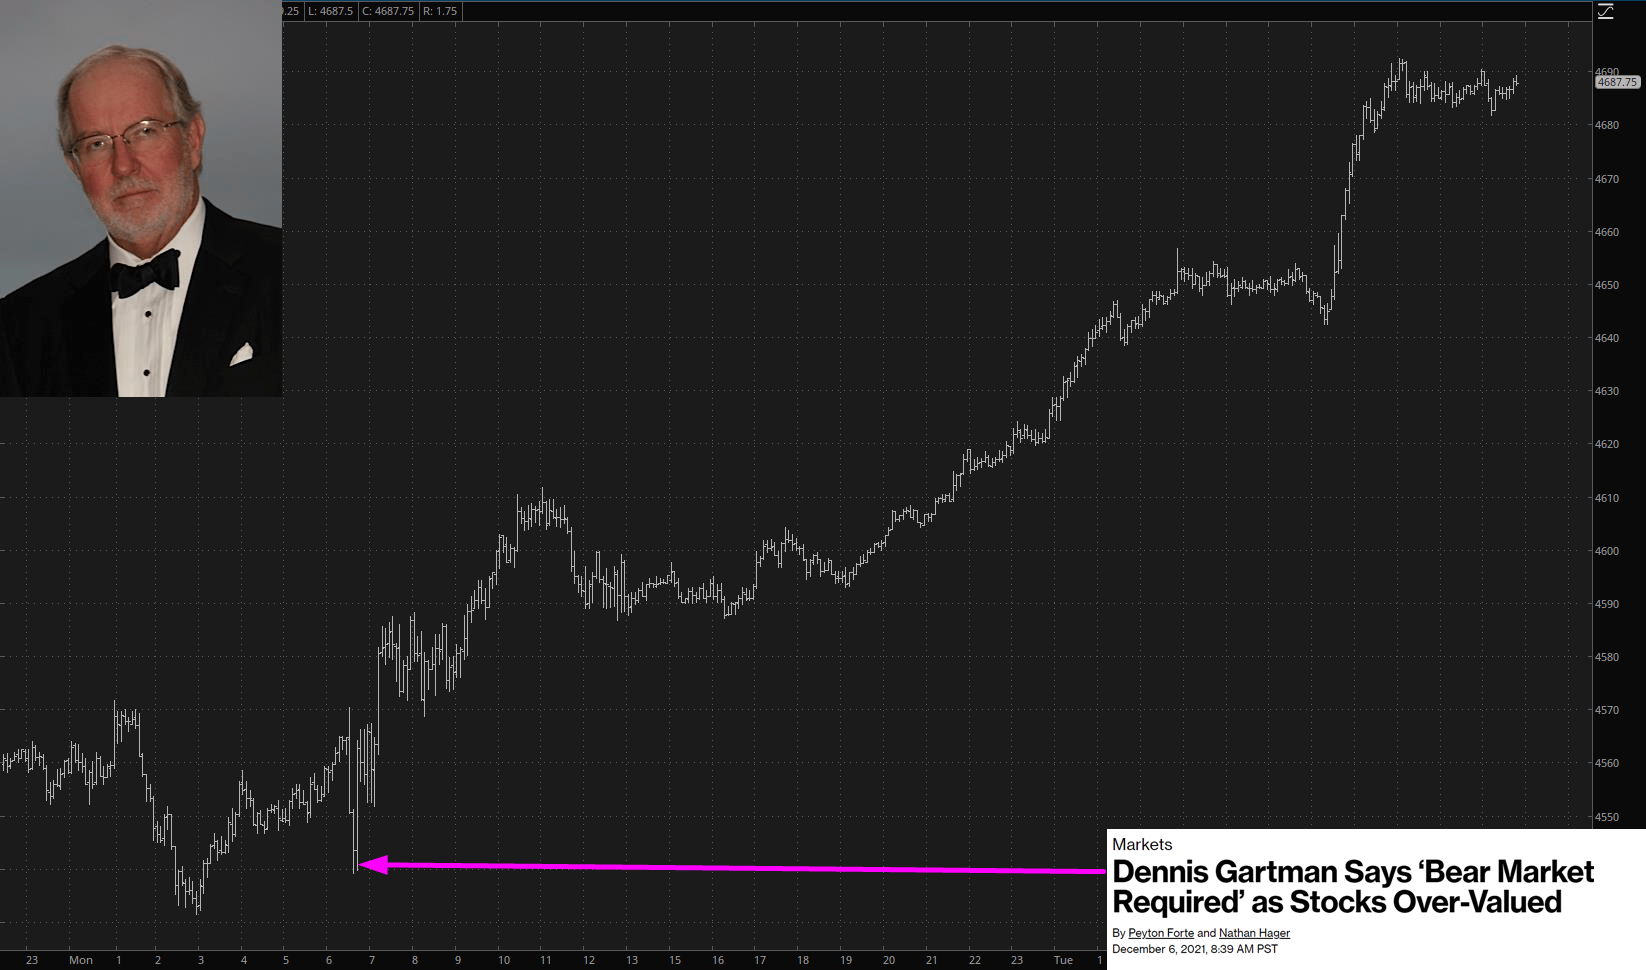
Well, none of us can claim to be surprised. If, out of a sample set of 400, the correlation is precisely -1.0, then you’re on to something. Yet, every time, I figure, meh, maybe the old bugger will be right this time. Nope. Never. Not even once.
Now that we’ve endured two vicious days of buying, allow me to offer this hourly chart of the /ES below. I would like to suggest we’ve seen this movie before. The last time, we had another hard tumble, taking out the prior lows, before ascending to new, lifetime highs. This isn’t a sample set of 400, however. Closer to a sample set of 1. But at least consider what took place the last time.
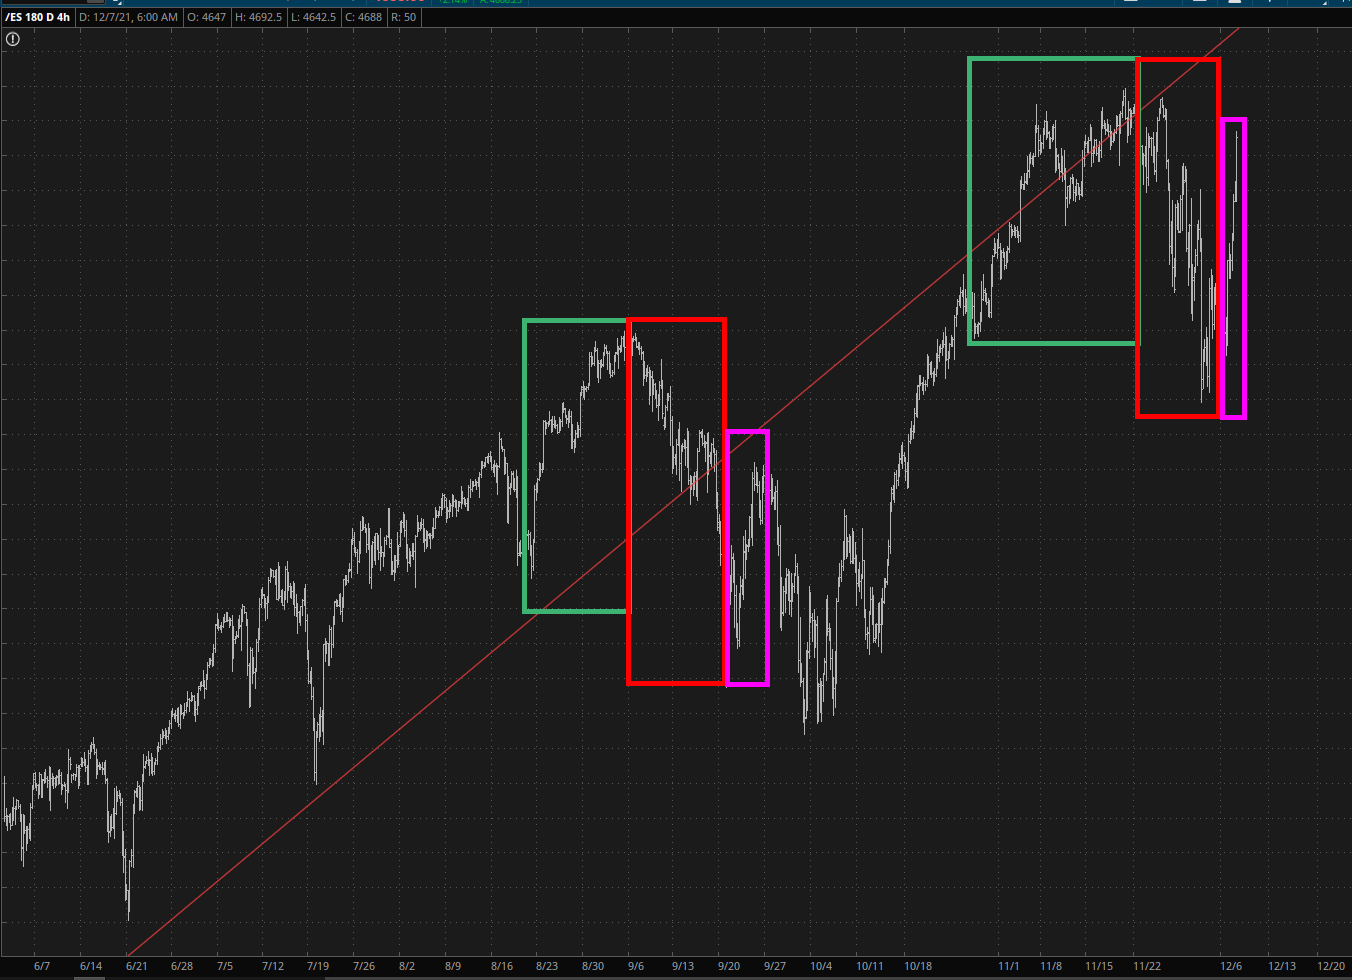
A far simpler way to view this, without an analog, is as follows.

If on Wednesday we simply have another day like Monday and Tuesday, well, forget it, I guess Strawberry Blonde’s outlook for an end-of-year melt up is true after all. Stay tuned.
