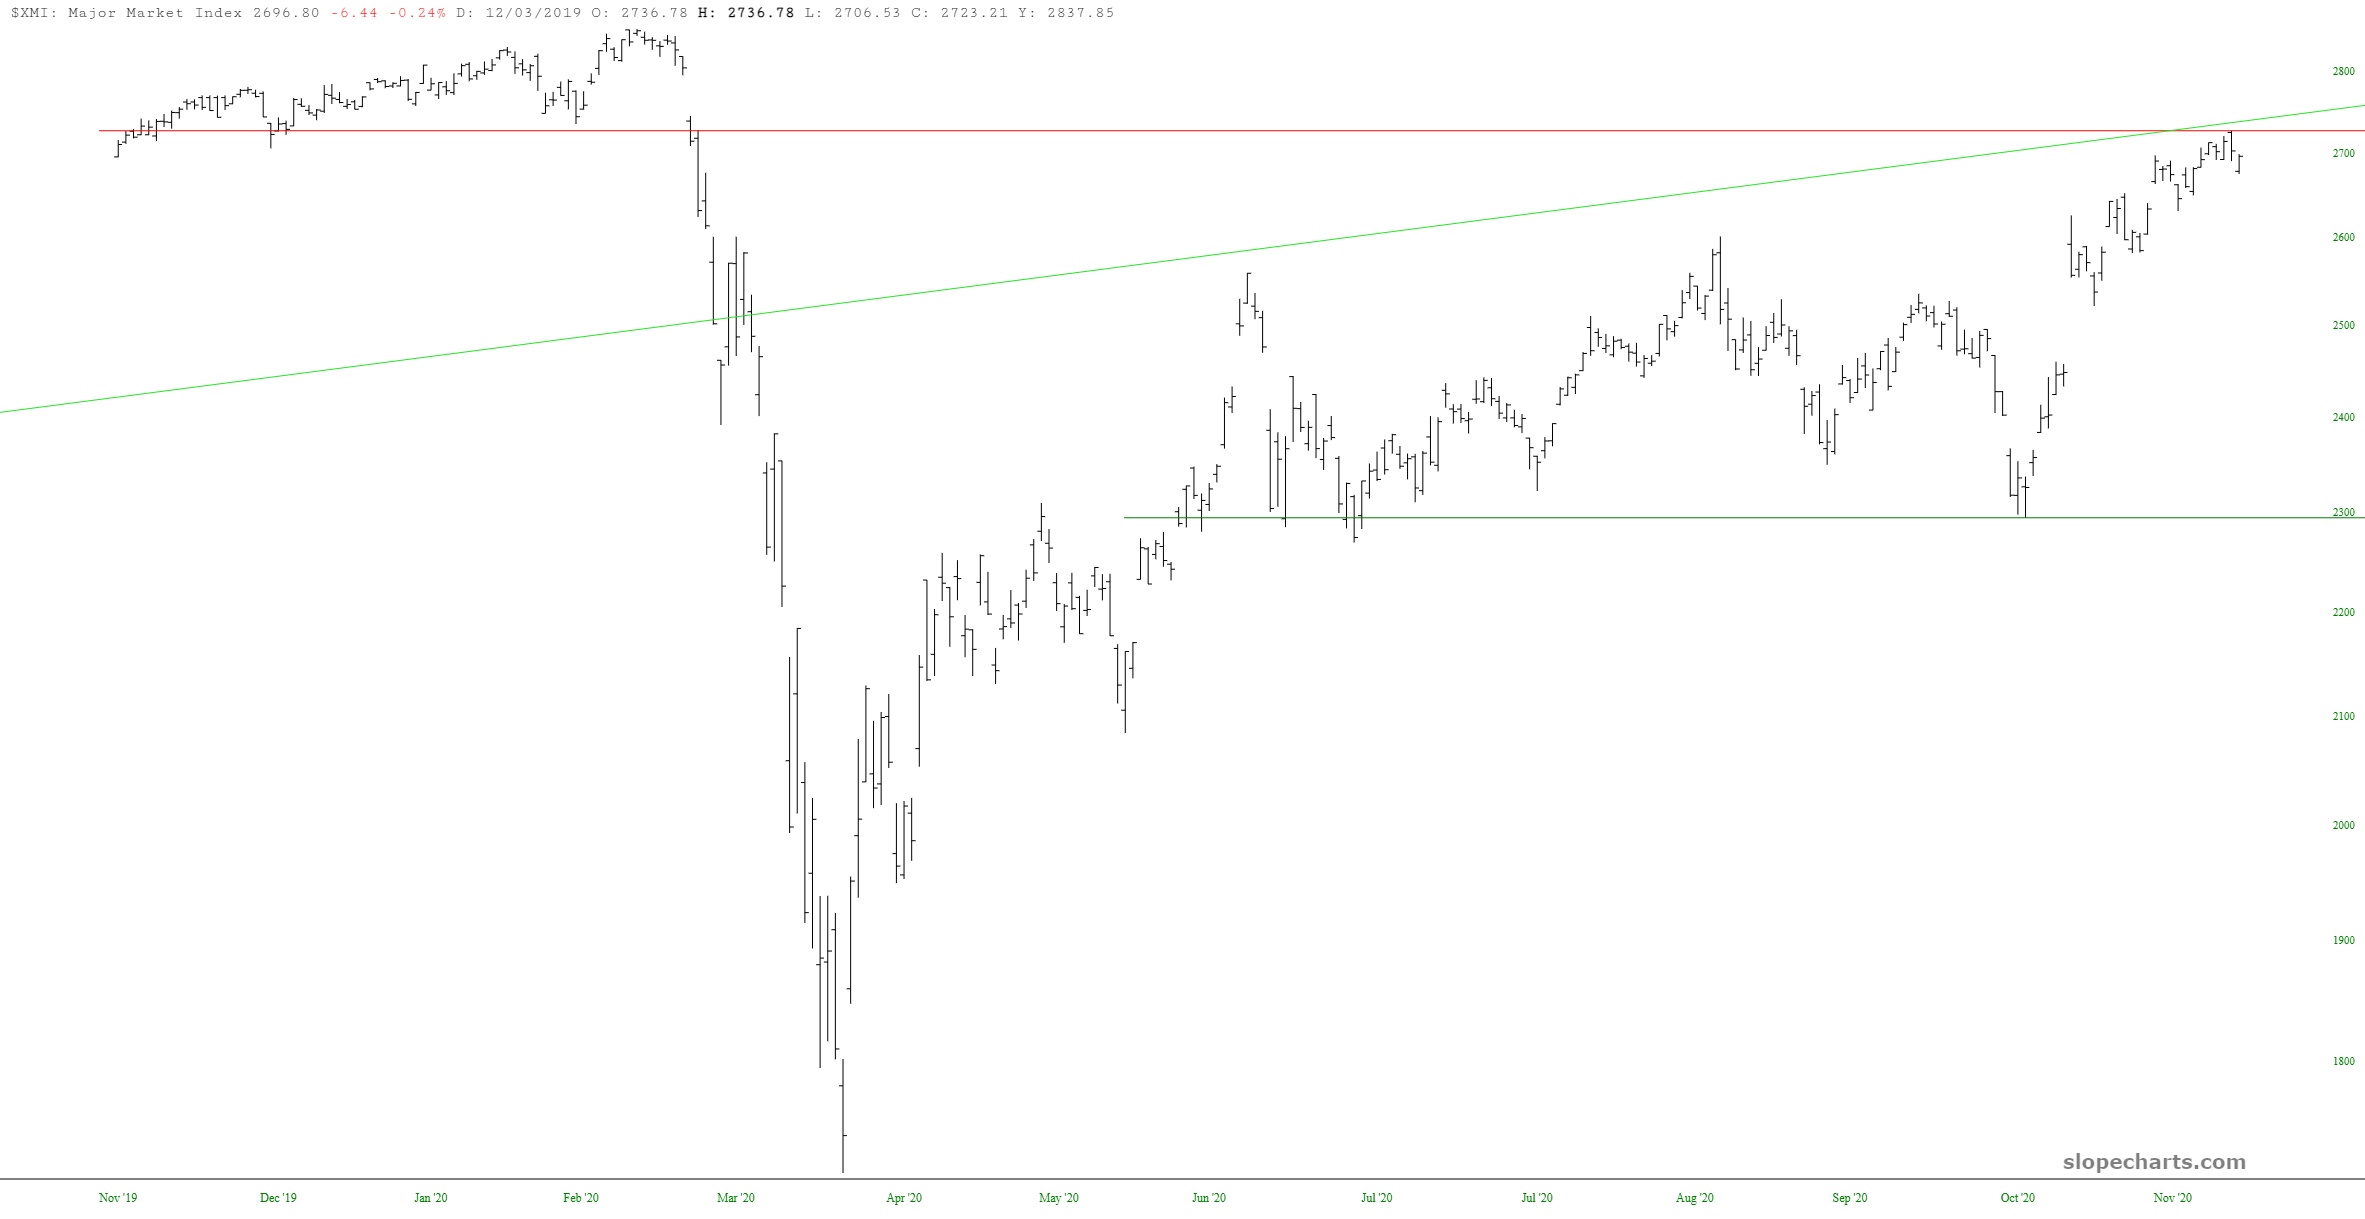
The chart below is of the Major Market Index (symbol $XMI). Click on it for a big version, and take special note of the long-term trendline in green.
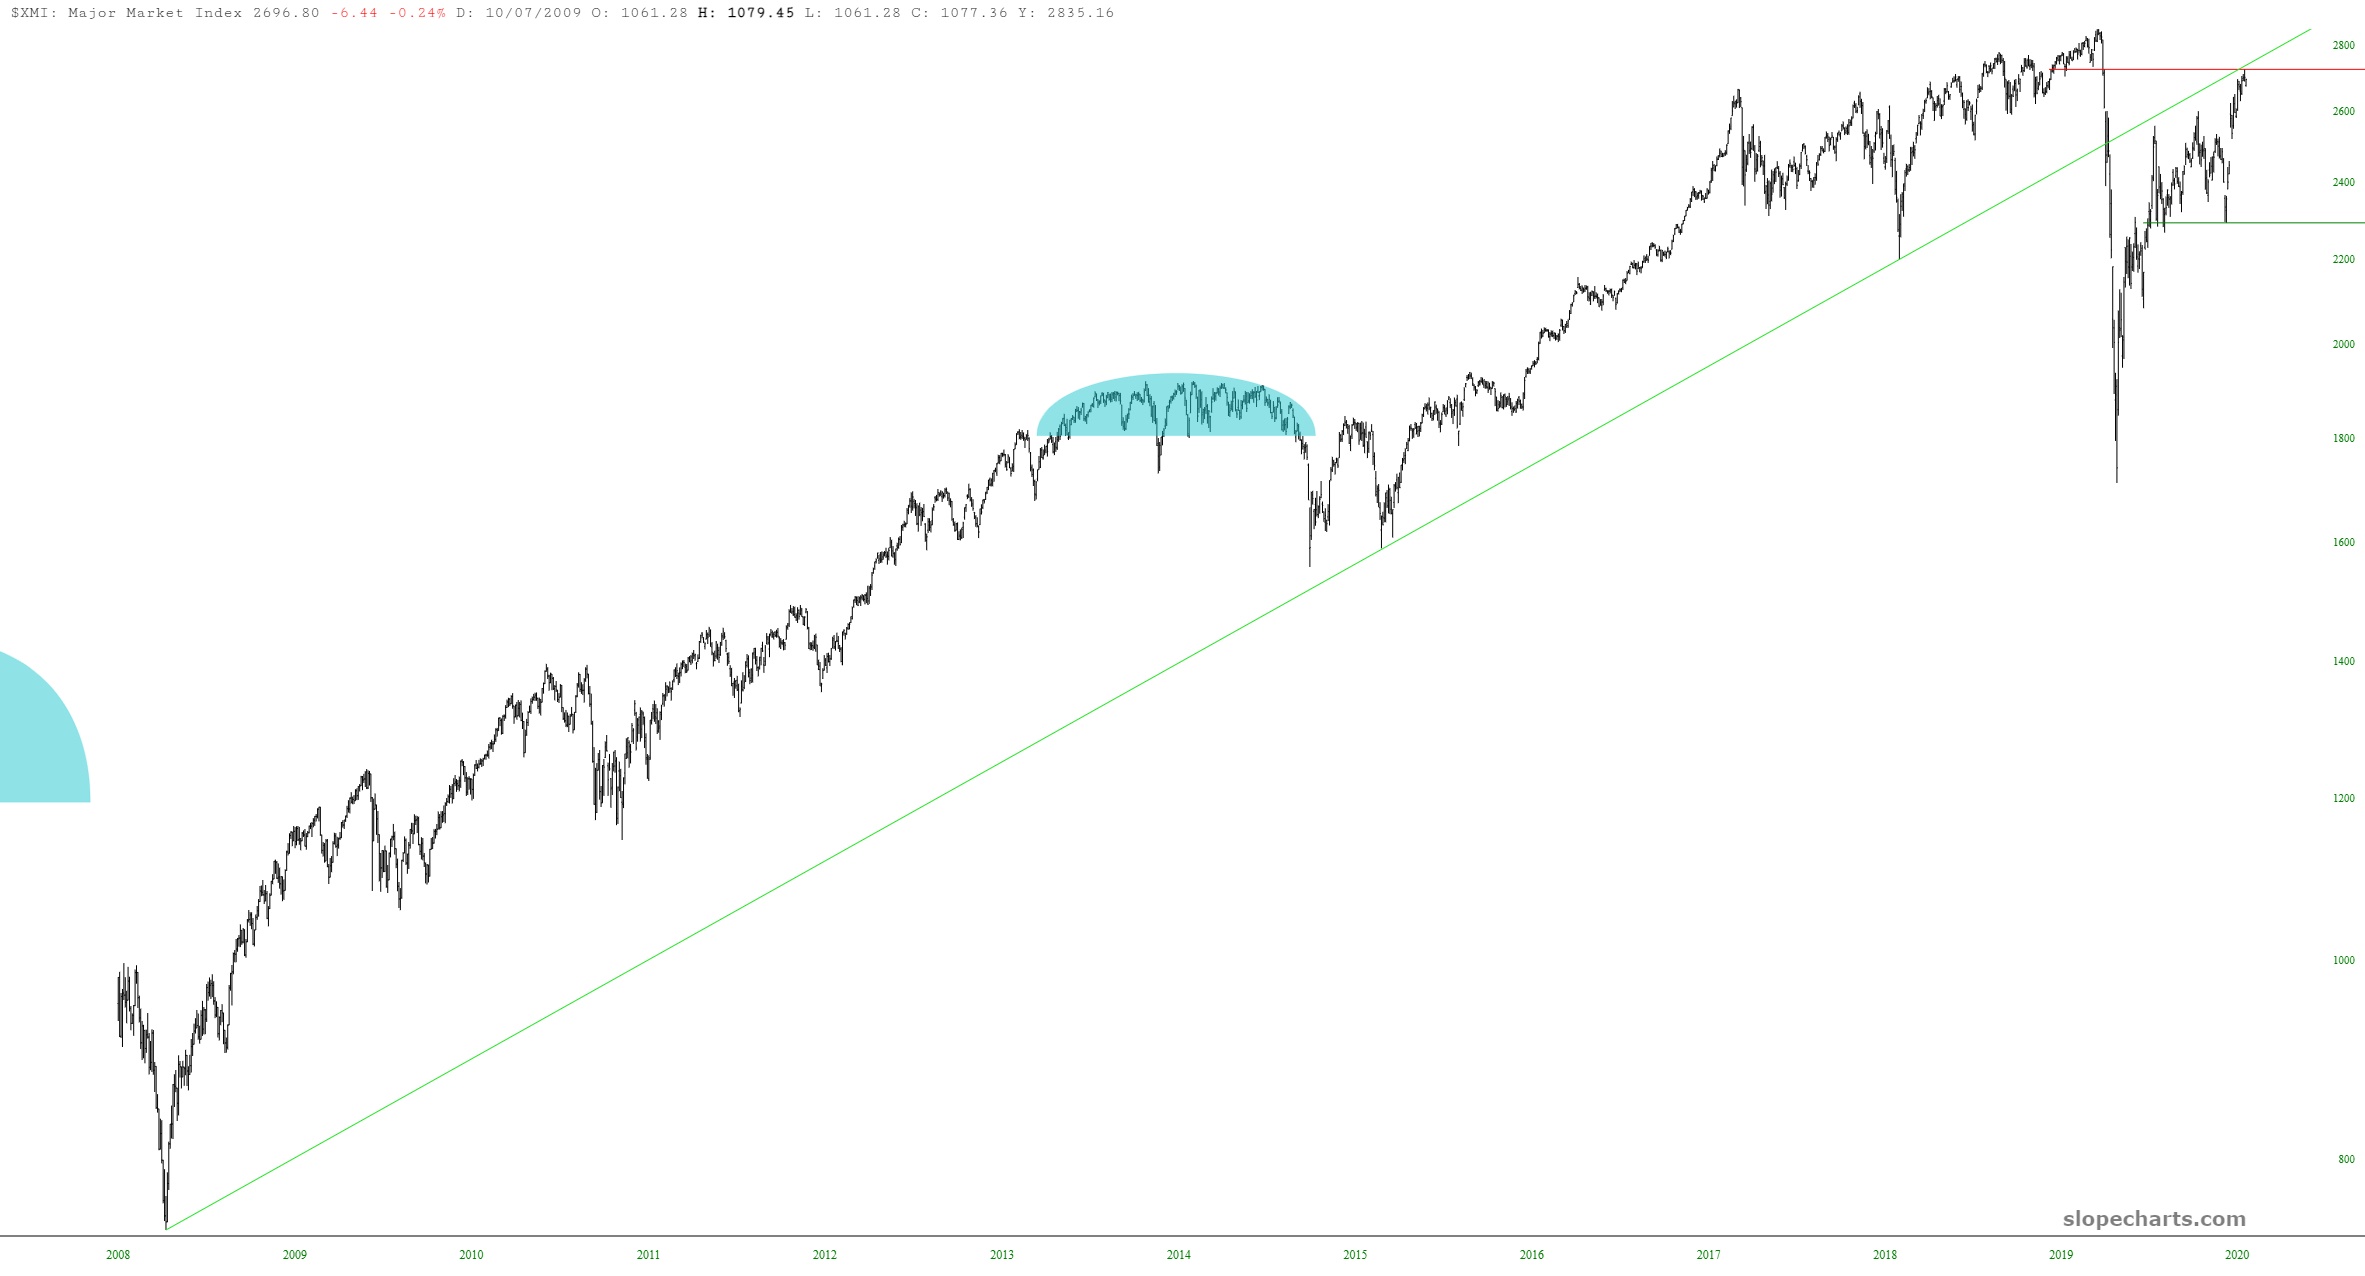
In particular, notice that this line was broken on February 28th of this year, having sustained itself for nearly a dozen years. More importantly, look at where we are at this very moment. Thanks to the reckless madness of the Fed, the trillions of dollars shoved down the esophagus of worldwide equities has brought us back precisely and exactly the underside of the broken trendline. Food for thought.