
Today was an historic day for multiple reasons. There were certain aspects of those, shall we say, histrionics that flowed into the market. I wanted to walk through these by way of horizontal price levels and tilted trendlines.
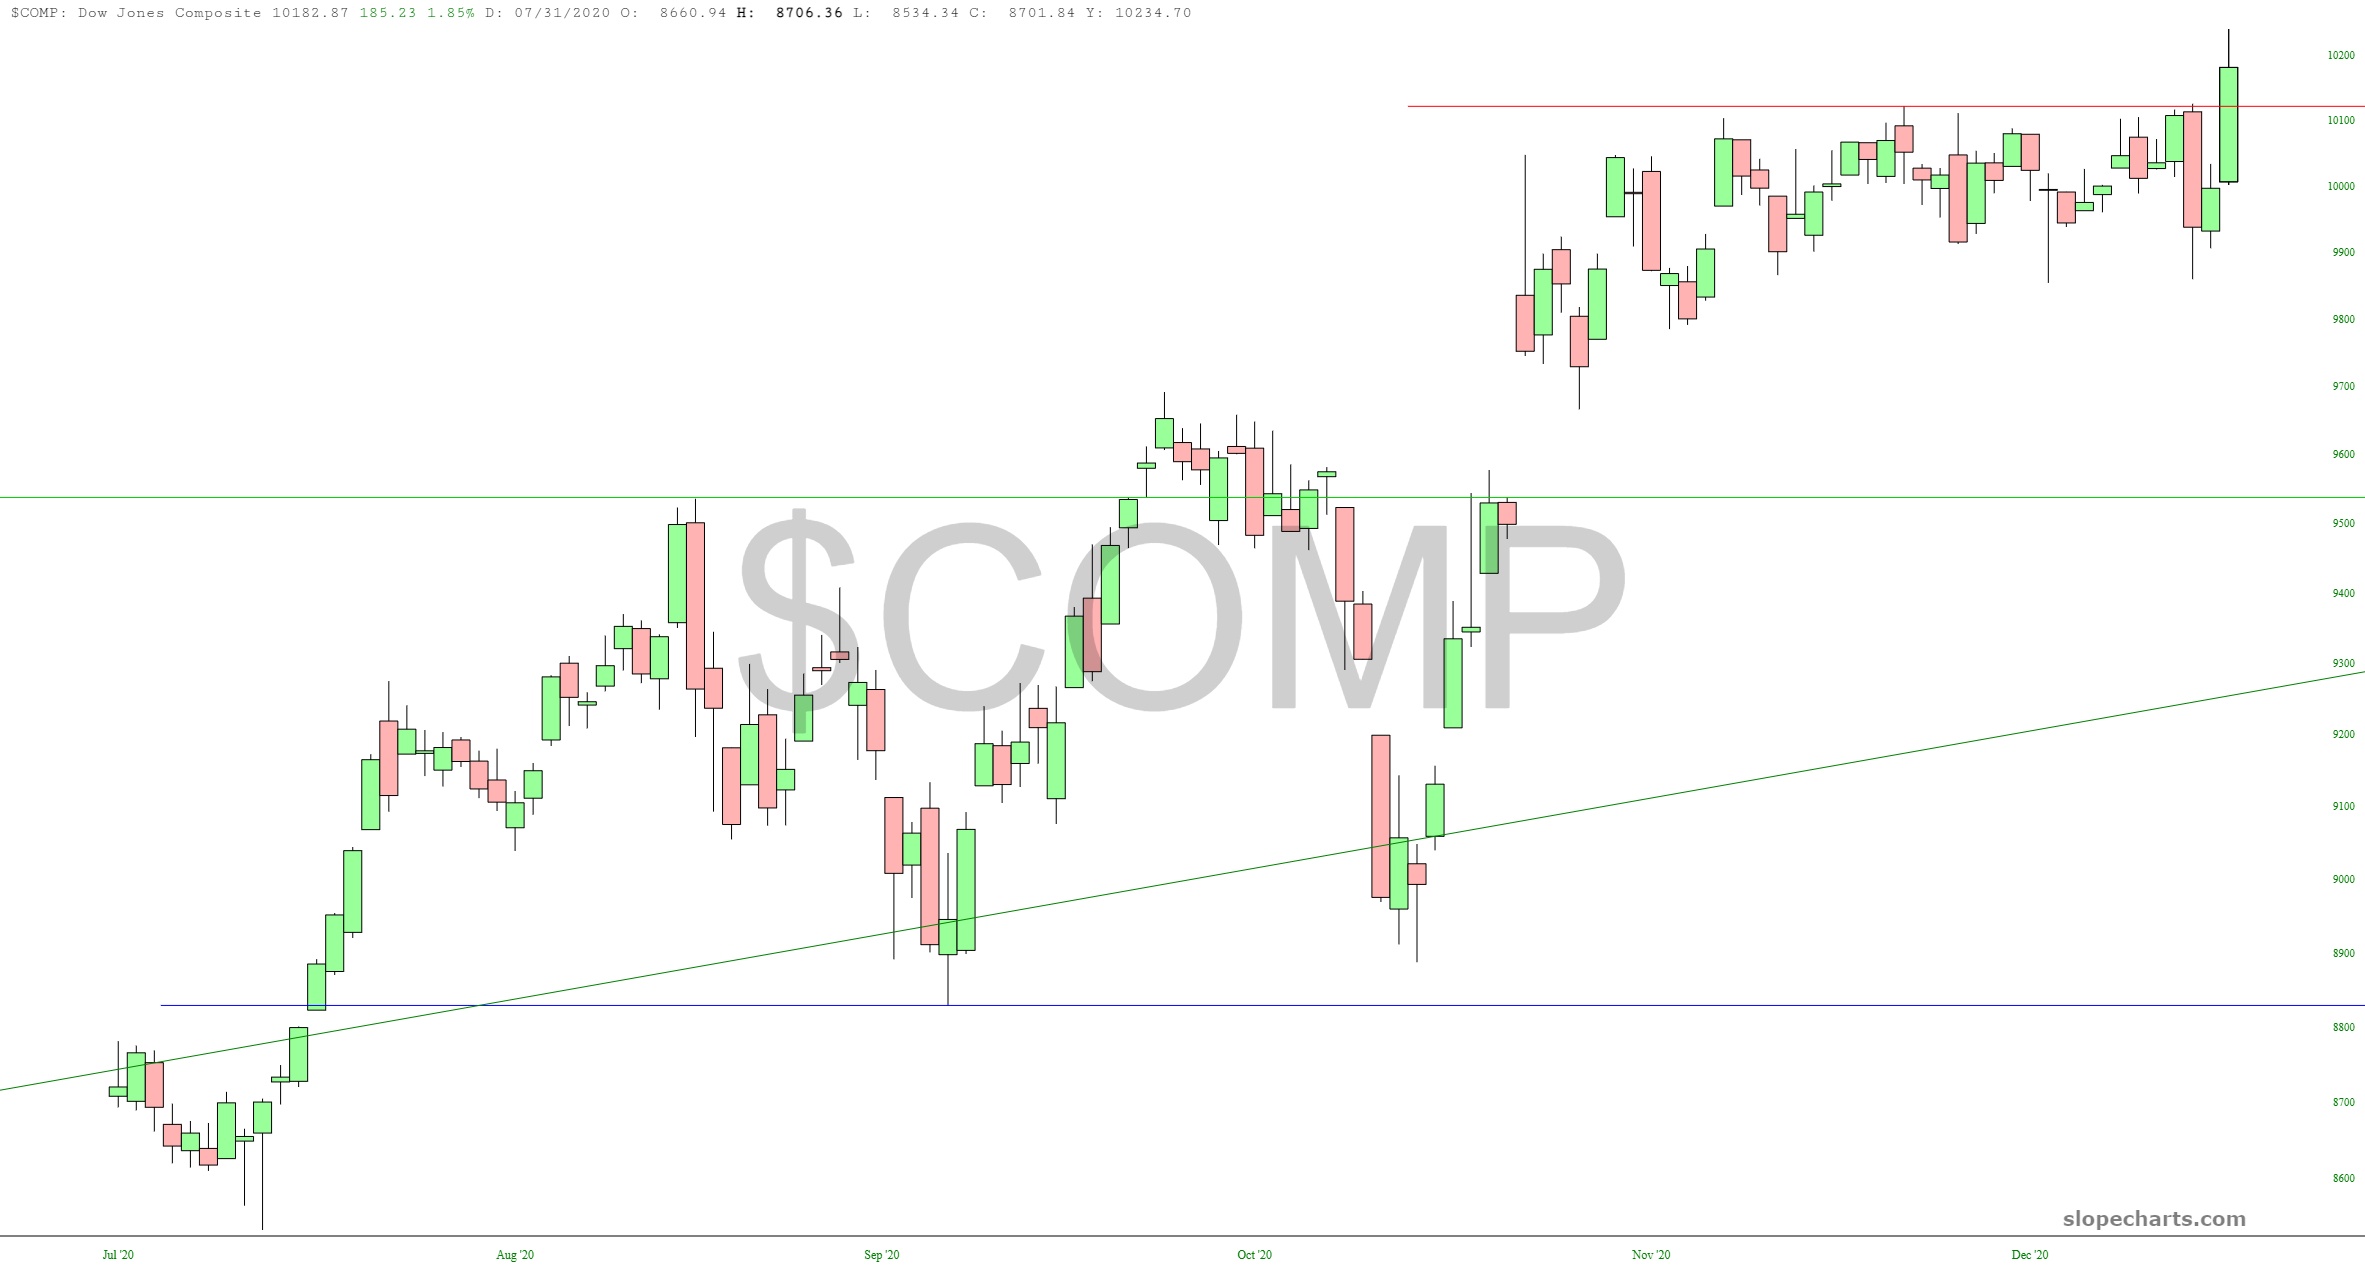
Let’s start off with the Dow Jones Composite, which reached escaped velocity. It has been cramped under that horizontal after since its last big “lift-off” day, which was November 9th. Now, about two months later, it got its next booster. Unless it tumbles below that line again, it seems it is merely positioned for another, higher, range.
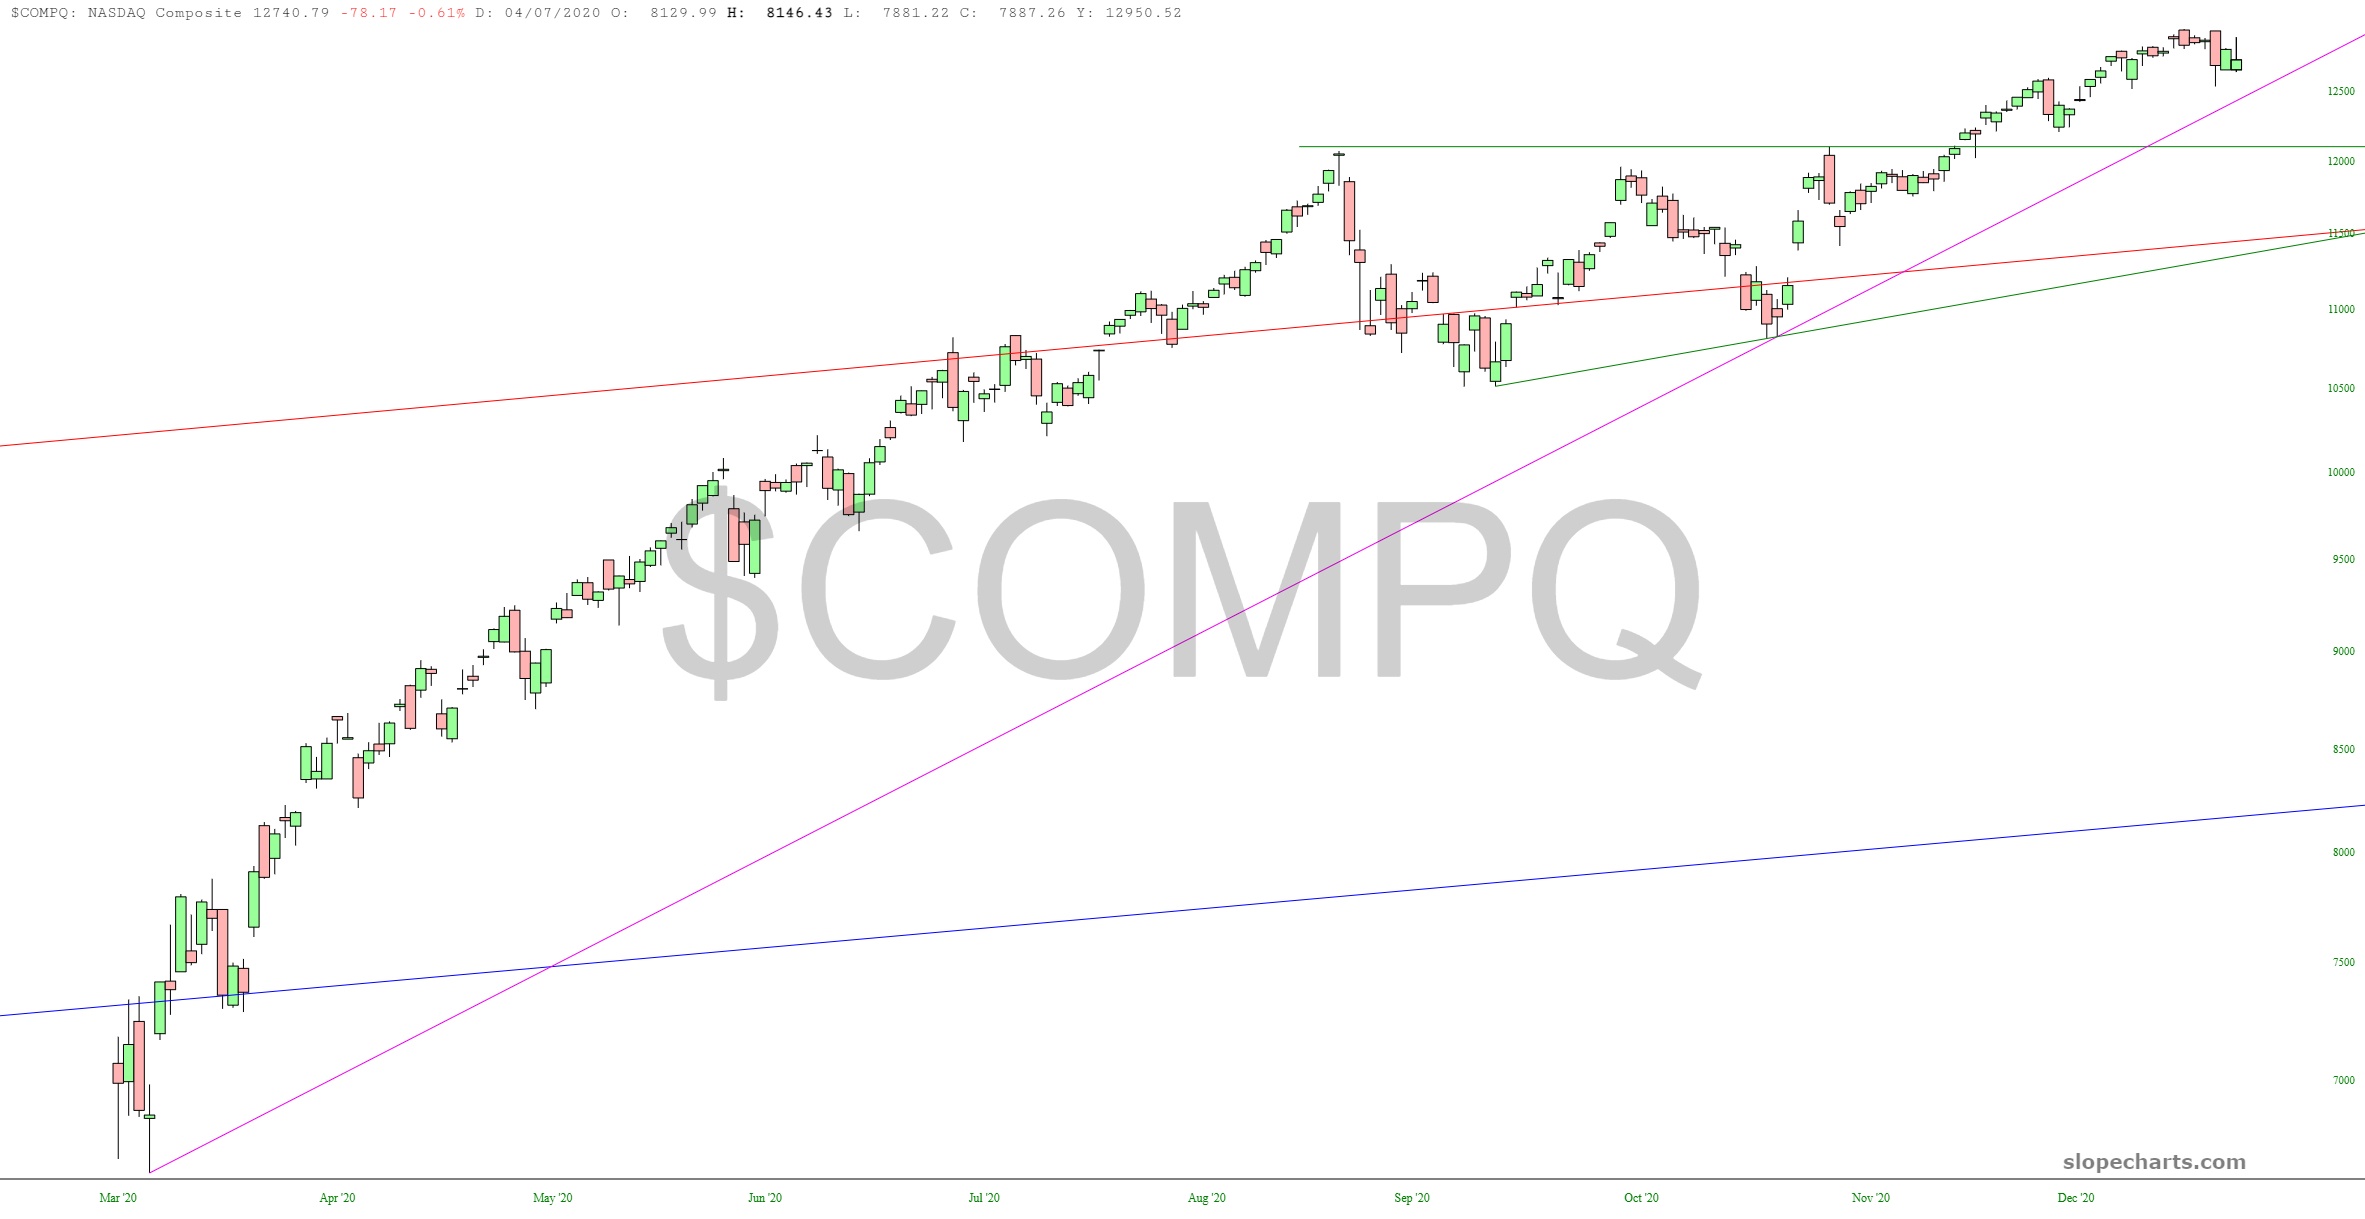
The NASDAQ Composite is a bit of a different story. I did something yesterday I hardly ever do, which is buy very short-dated puts (January 15th, and frankly, I was about to get the January 8ths!) By dumb luck, the tech stocks fell hard today, so I scurried out of my puts for a 50% gain. No real breakdown has occurred, however. It’s really all up to the supporting trendline.
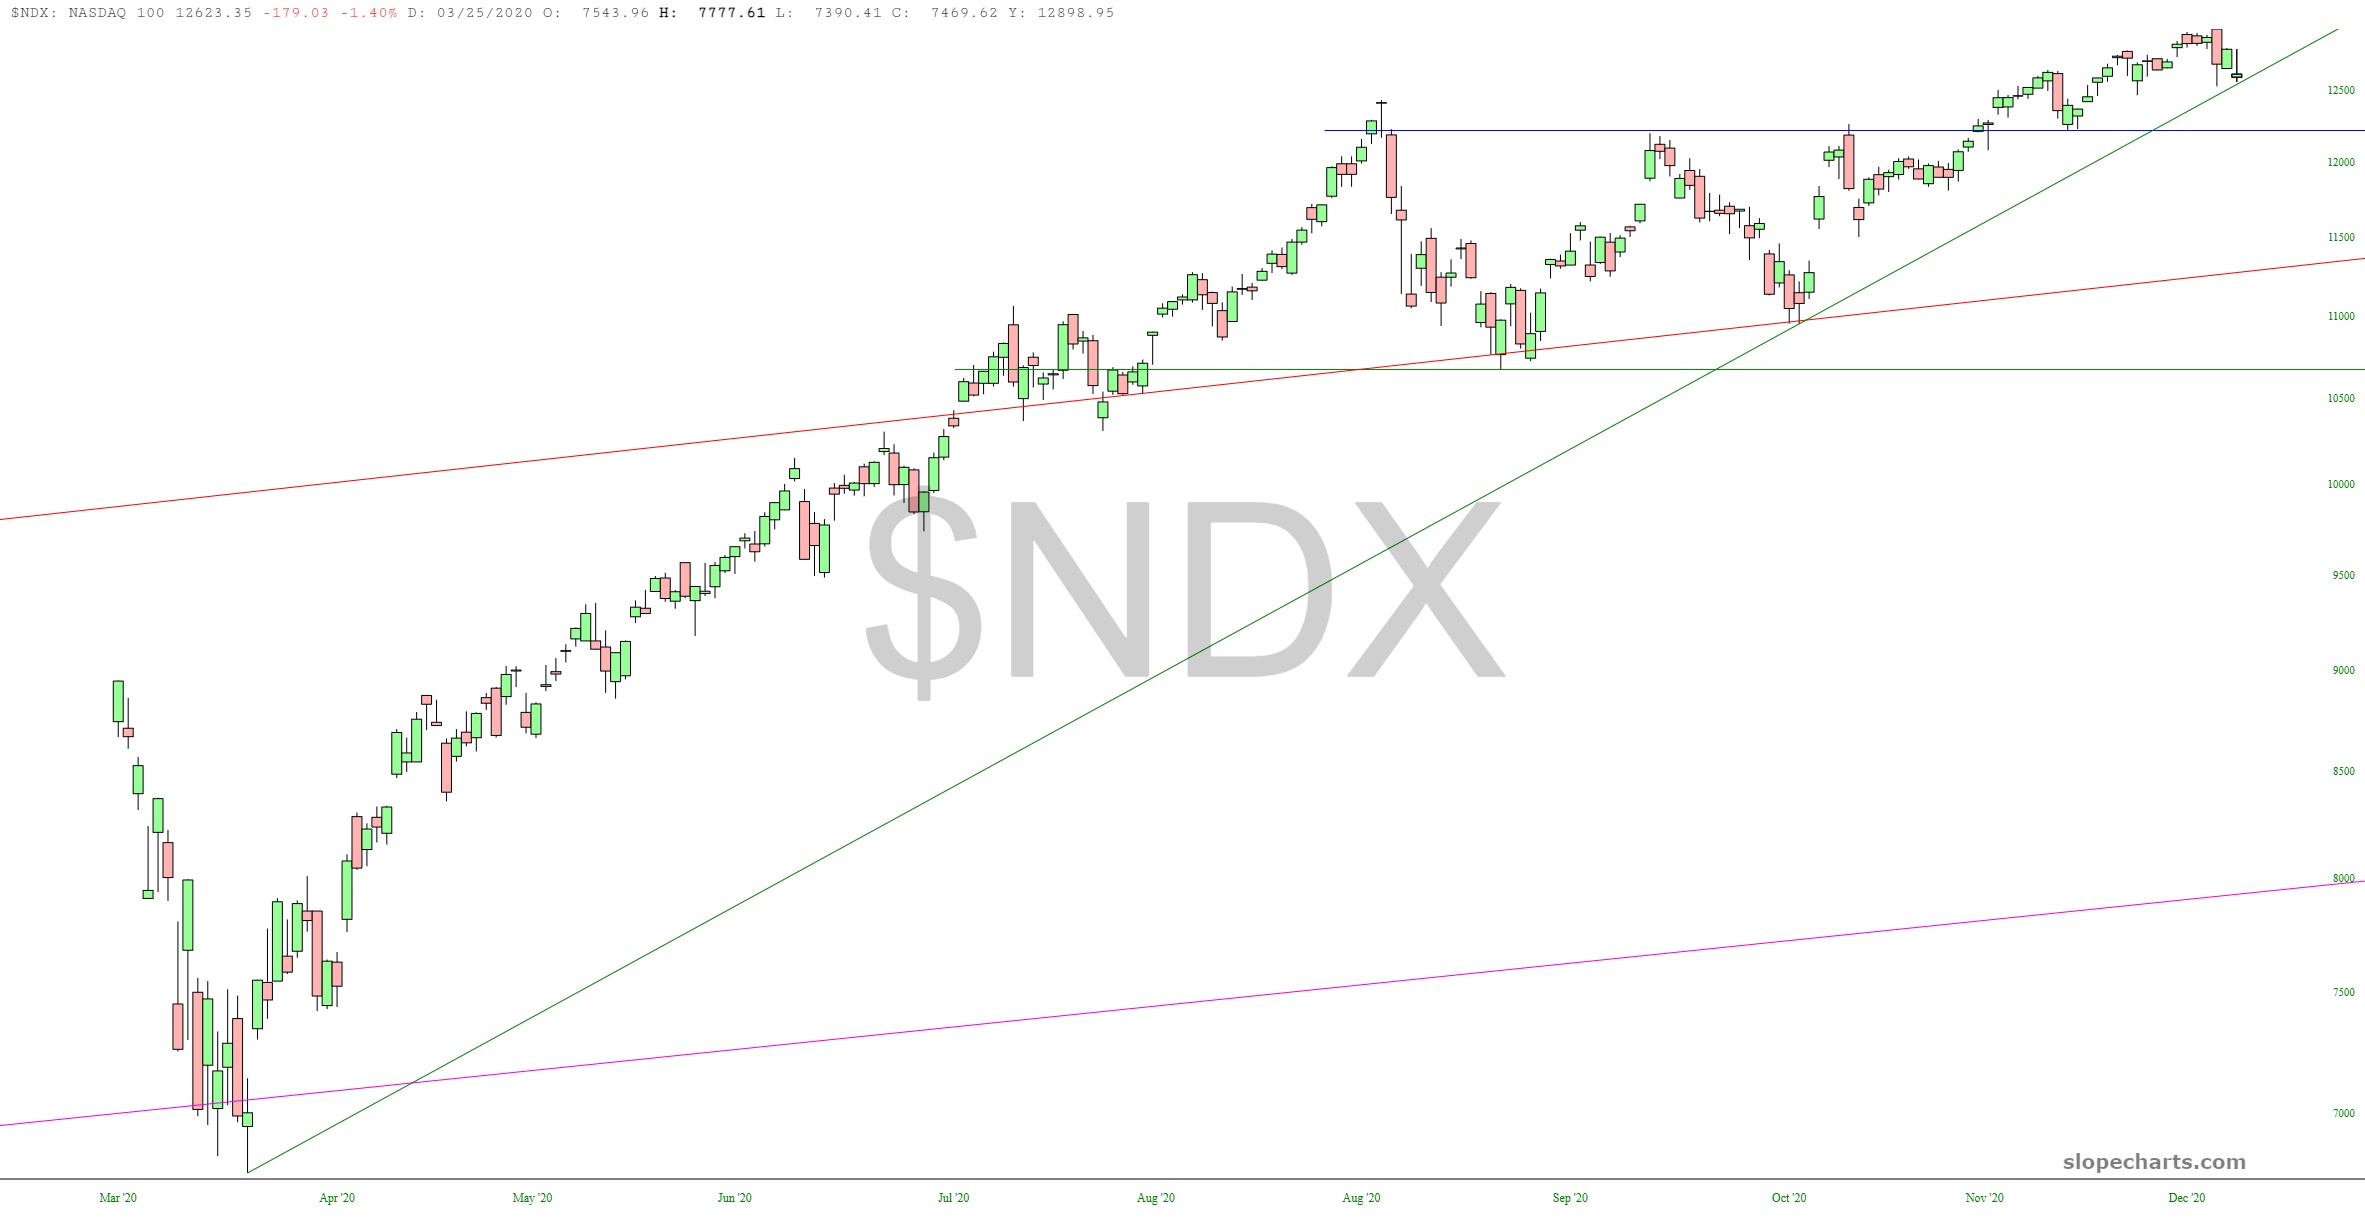
A very similar trendline exists for the NASDAQ 100. As I am typing this, the futures are green across the board (except for bonds, which got blasted on Wednesday), but as we all know, that hardly means anything these days.
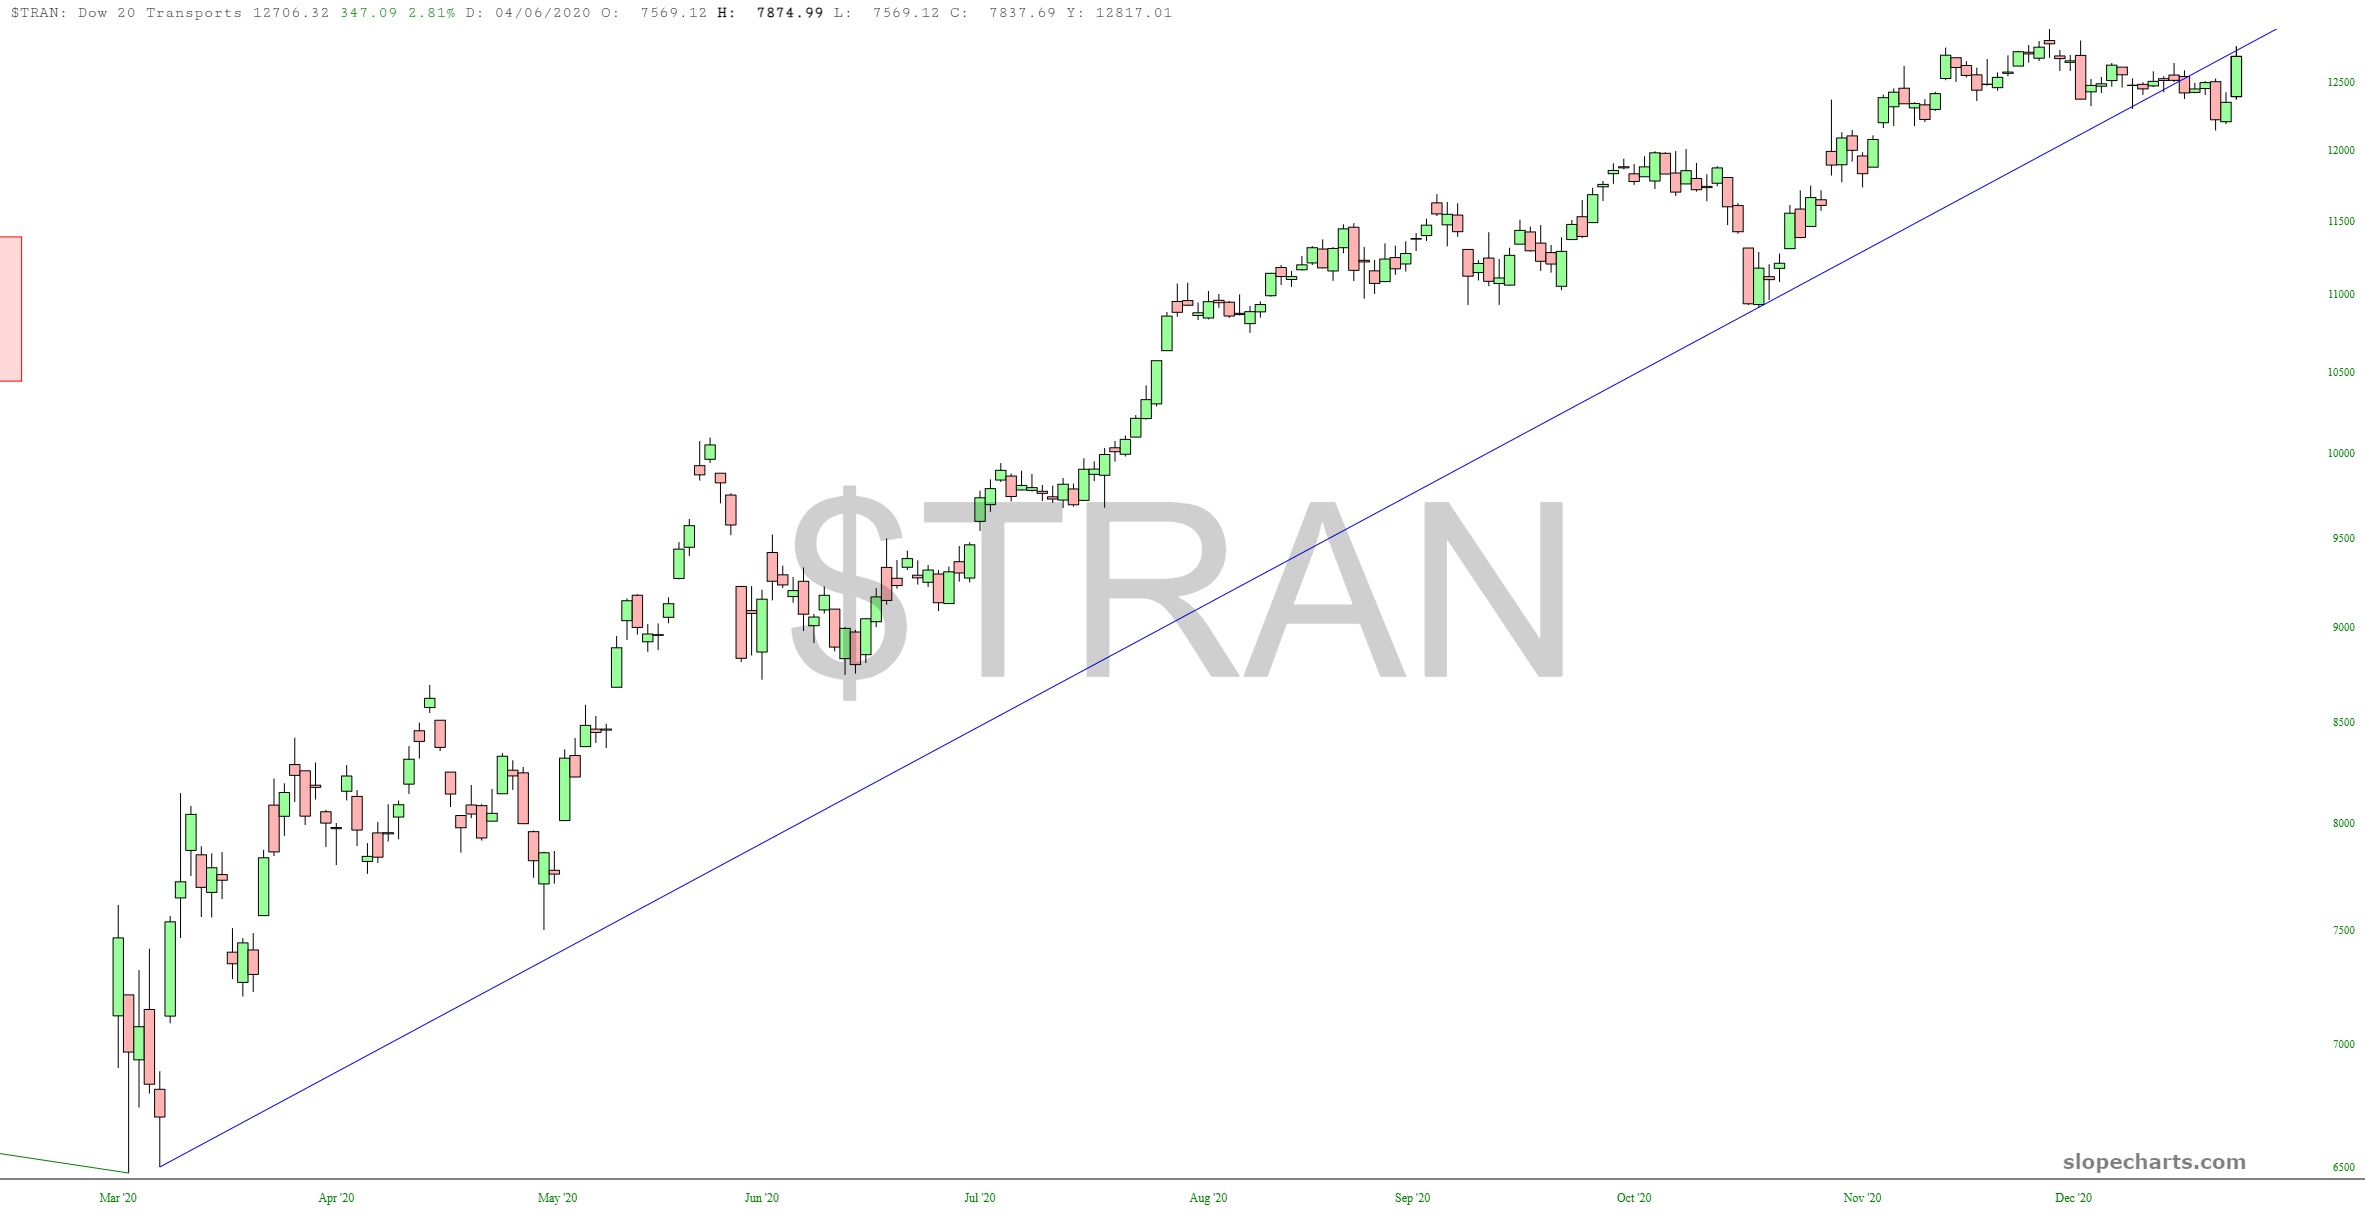
One of the most interesting cash index charts right now is the Dow Transportation Index, whose trendline is already broken. Today’s big rally pushed the price level to precisely below the broken trendline. That’s precisely what is supposed to happen: what used to be support is now resistance.
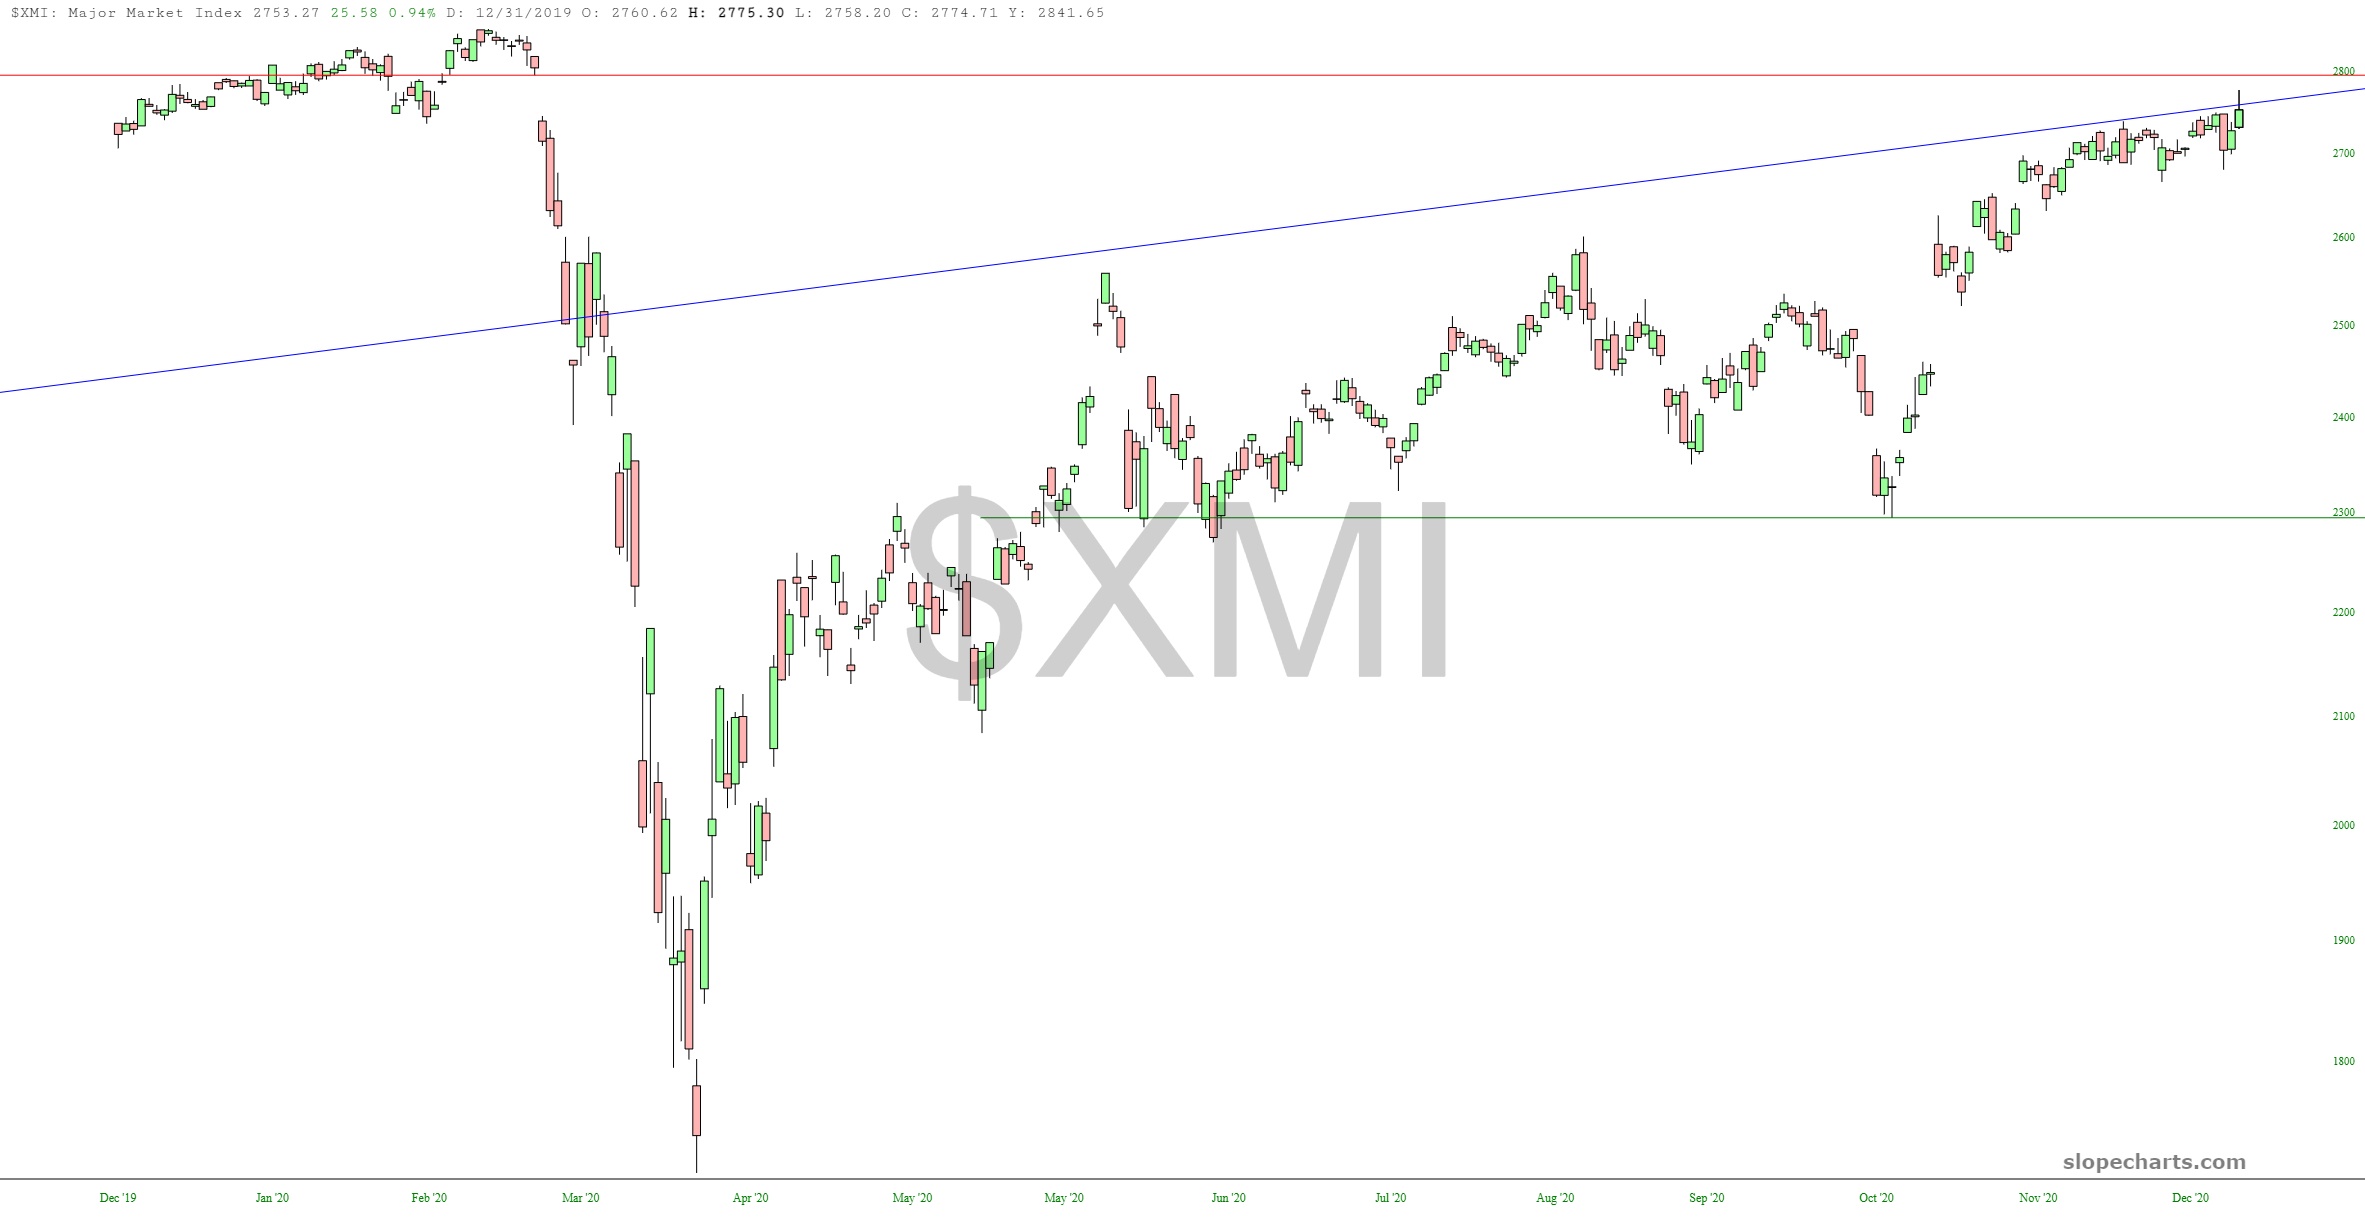
The Major Market Index is also an interesting juncture, just beneath a price gap which has been in place since February. Of course, gaps aren’t impregnable, as XLF and KBE clearly demonstrated today. But as long as they remain unfilled, they are worth observation.
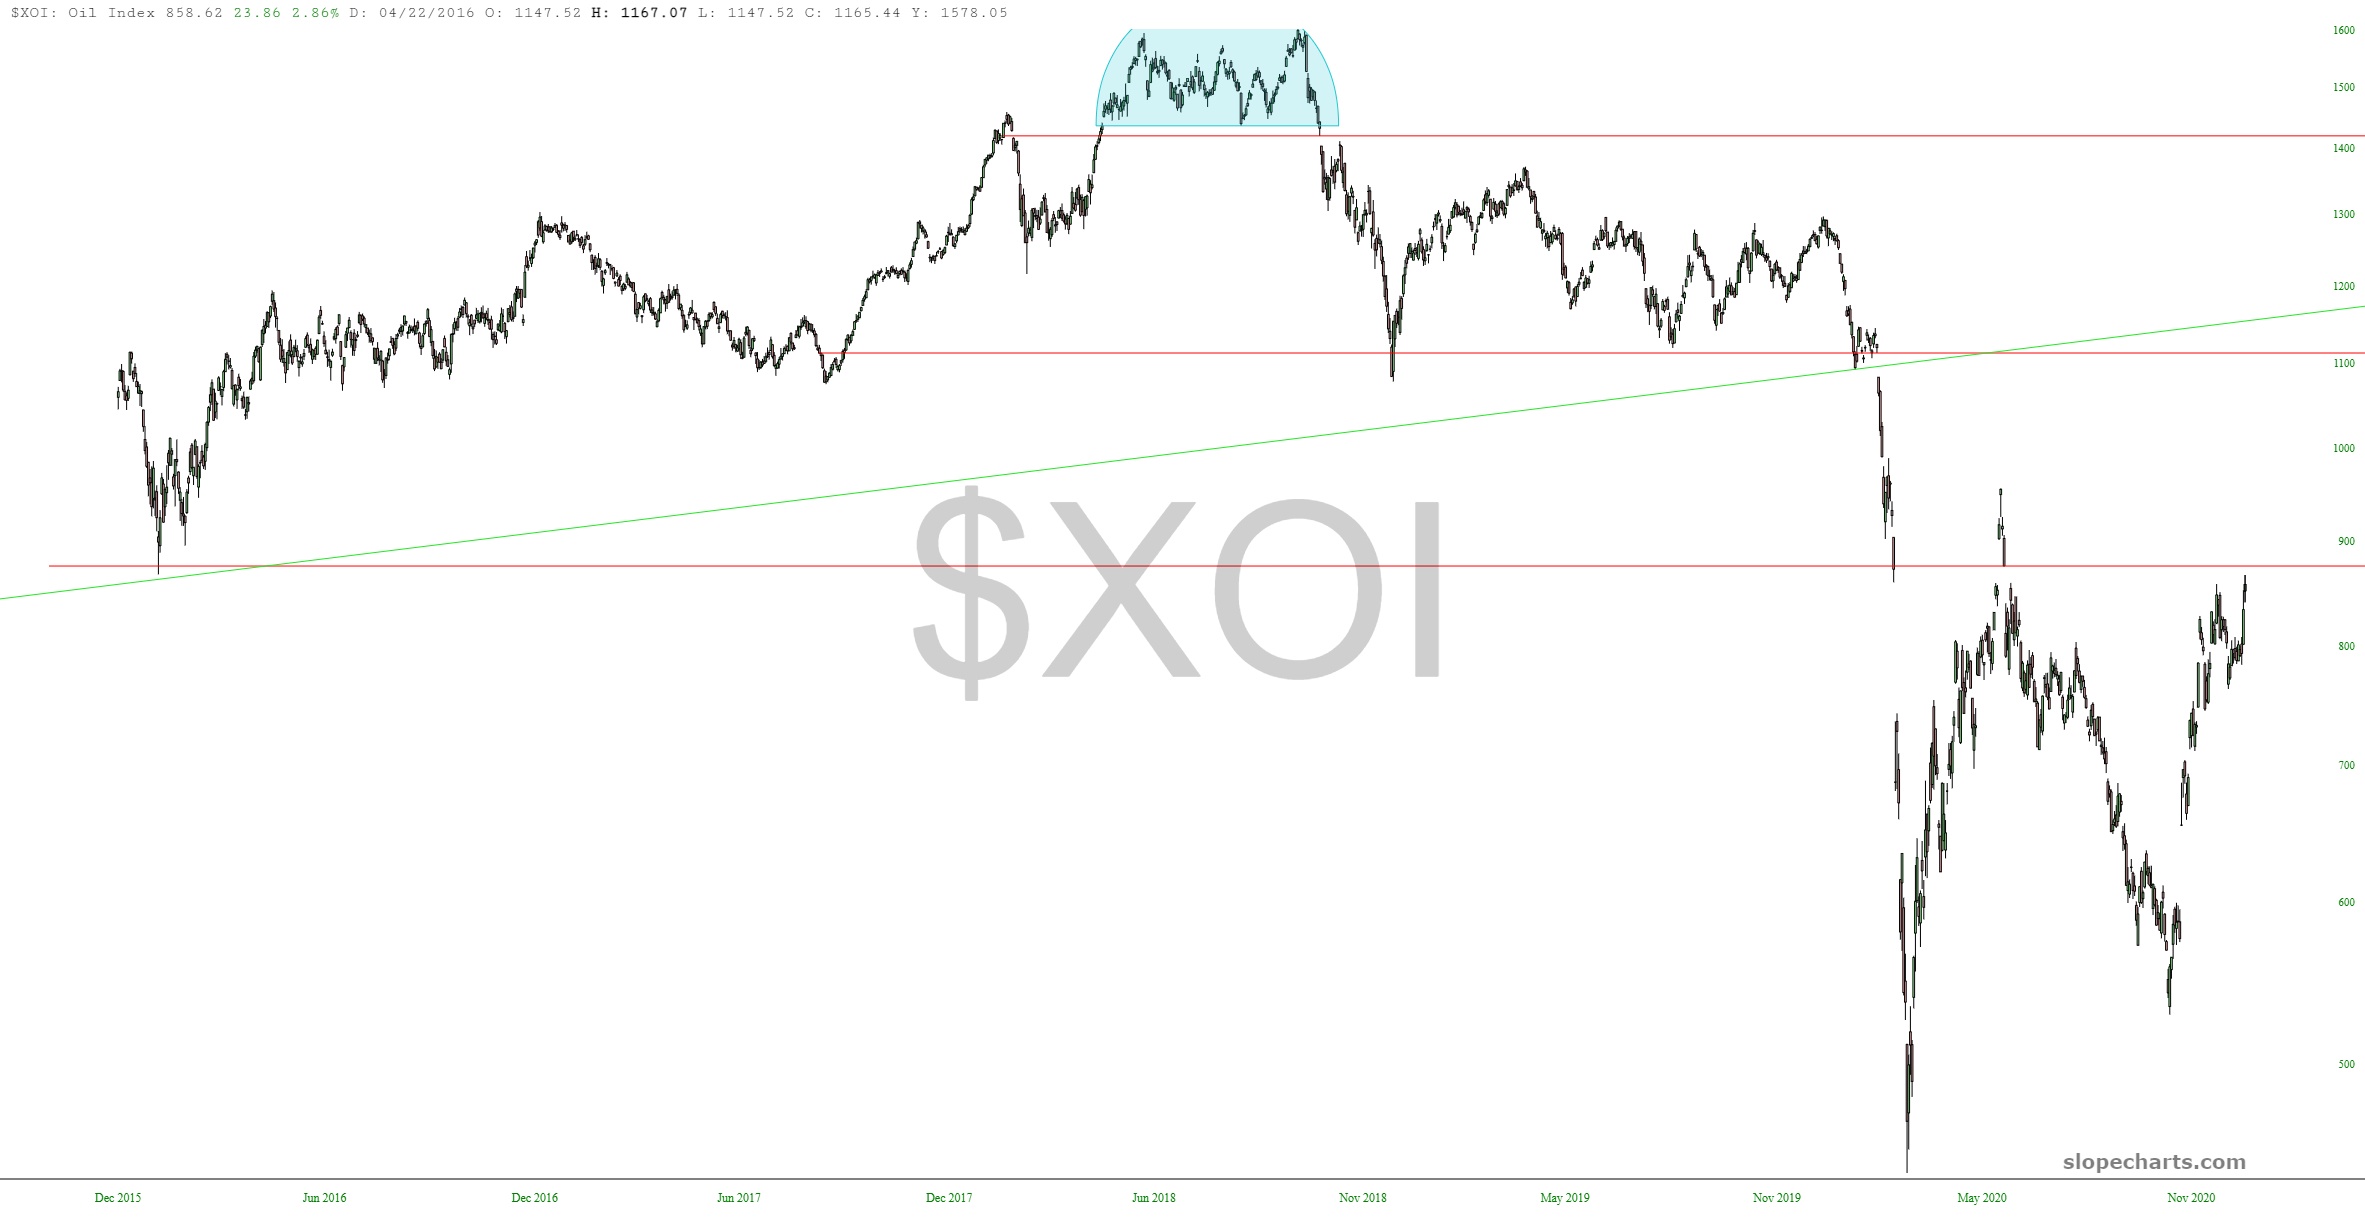
The last equity index I wanted to show was the oil index, which had an explosive day higher yesterday and is also sporting a very clean price gap.
I’m sure we’re all googly-eyed over the ascent of cryptos (and, if I may pat myself on the back a moment, my alt-coin charts were quite prescient – – – it’s nice to have one chart-friendly market still around!) Just for the hell of it, I decided to look at the next Fib projection, and, shield your eyes, it’s almost at $52,000. Errrr, it’s disquieting how crypto has basically not taken a breather for so many months, but all the same, if these Fib anchors are correct, that’s the next major target.

