
I’ve been having a great holiday with lovely scenery and weather. There is only a slight pall on the week that it has been one of the most interesting weeks of the year, and that I called all the key levels on Monday morning, so I would have had a really very nice week had I been working. That’s life I guess.
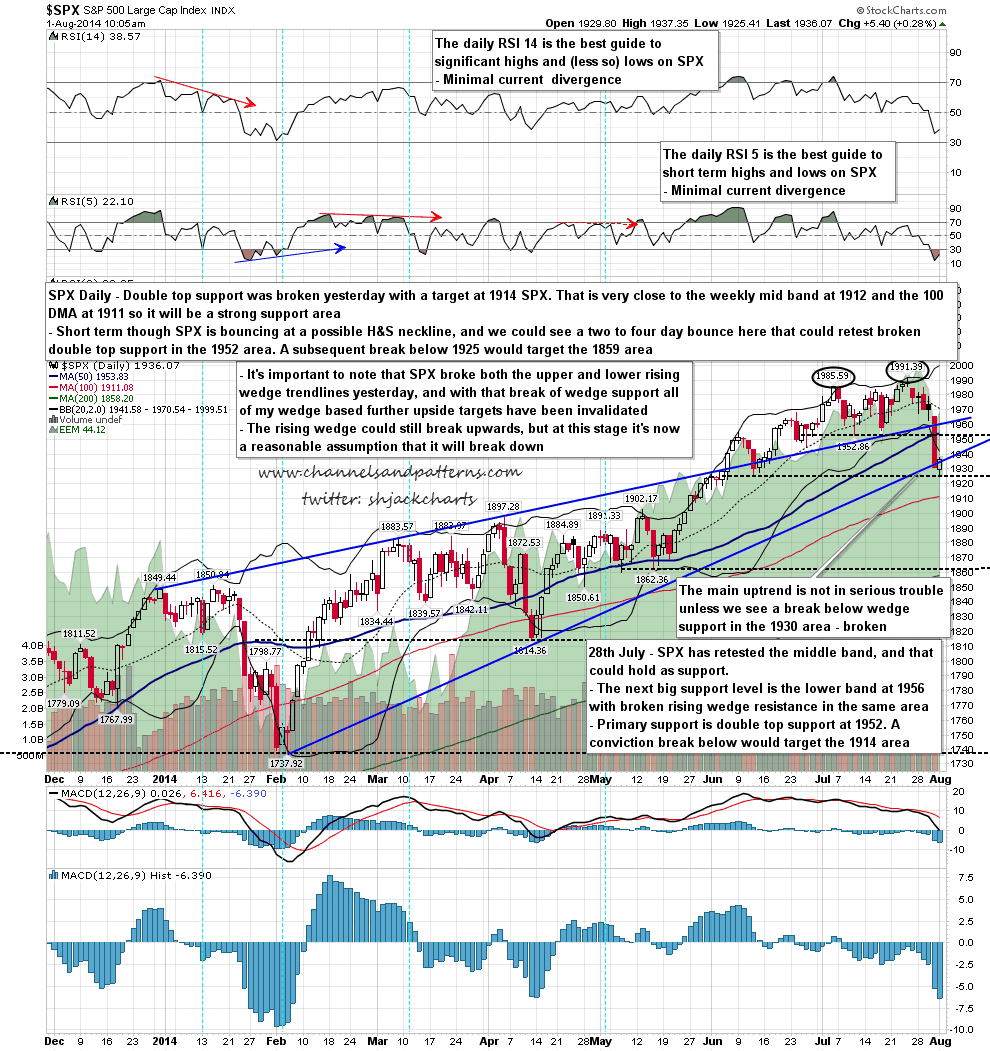
On SPX the break below double top support yesterday morning targets the 1914 area, close to the weekly middle band at 1912, and the 100 DMA at 1911. That area should be strong support. The strong support I mentioned on Monday under the double top support level was rising wedge support from 1737, but SPX broke back below broken rising wedge resistance and then broke and closed below rising wedge support. Rising wedge support is now therefore broken.
That was a very significant support level and it’s worth mentioning that the upside targets that I had given on the basis that the wedge might be breaking up are now invalidated. It is still just possible that this wedge could break up, but that would be rare, and it is now a reasonable assumption that this wedge is breaking down.
The short term options here are either that SPX proceeds directly to the double top target in the 1914 area, and most likely starts a decent bounce from near there, or that we see a two to four day bounce start from the current low at the possible H&S neckline at 1925. In the event that we see the bounce from 1925 the ideal rally target would be a test of broken double top support in the 1952 area, and on a subsequent break below 1925 the H&S target would be in the 1859 area. SPX daily chart:
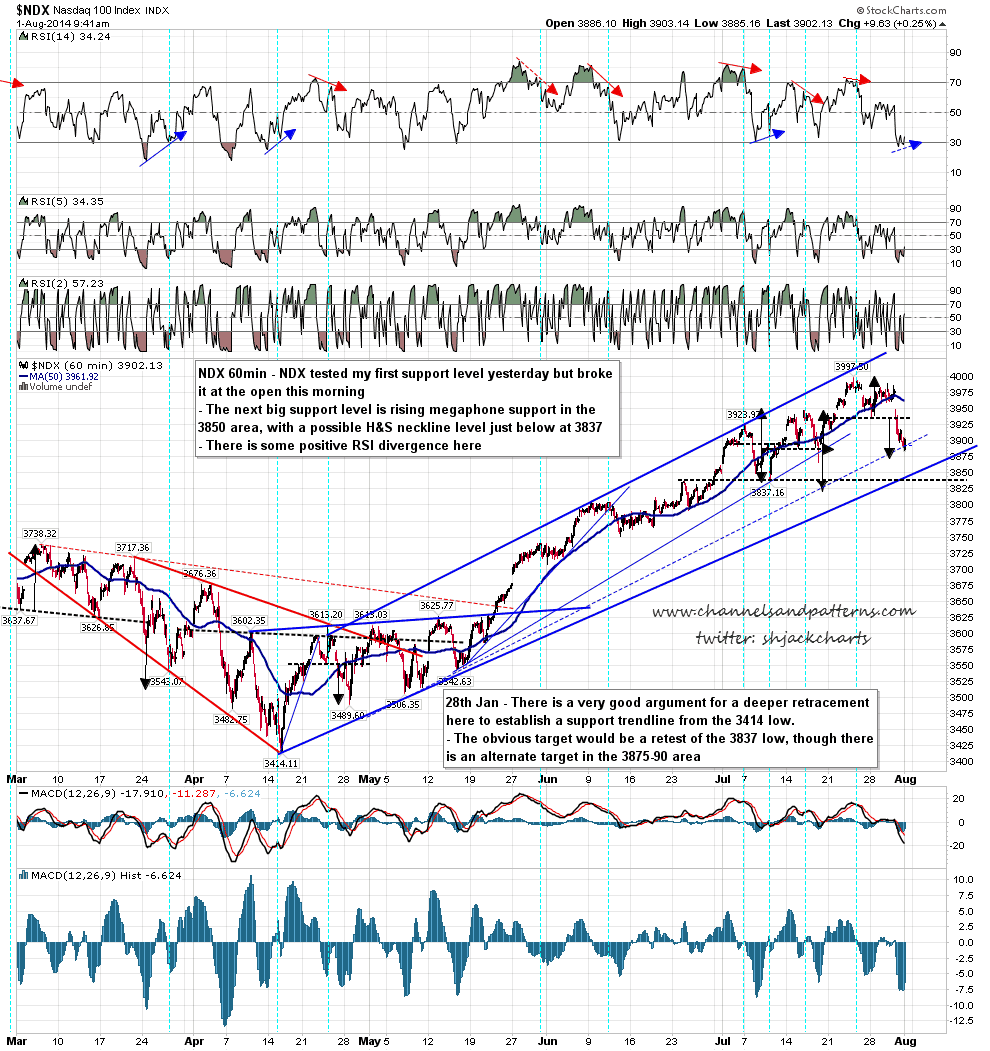
NDX is suggesting further downside here. The first level of support I gave on Monday was the low yesterday and broke at the open this morning. The next target is rising megaphone support in the 3850 area or the possible H&S neckline just below at 3837. That said there is some positive divergence on the 60min RSI, and we could well see a bounce to match a possible right shoulder bounce on SPX from 1925 before turning back down. NDX 60min chart:
The break below wedge support on SPX yesterday was a very significant support break, and suggests strongly that we will see at least some more downside. If we reach the double top target in the 1914 area before a rally then that rally could retest the current highs. If the bounce starts from the current low at 1925 then it would most likely peter out in the 1952 area and set up the next big leg down.
Normal daily posts will resume on Monday morning.
