
(Note from Tim: just about the only person I’m in contact with throughout any given trading day is Northman Trader, who was kind enough to share the post below. Click on any of the images for a big version. I’d like to add that Northman tends to be much more evenly-balanced than I am, and he isn’t running around beating the bear drum constantly like me, so take that into account when reading this:)
We’ve been bullish from a trading perspective this week and it has worked out great, but we are chartists and what we are seeing is concerning. We’ve talked about structural macro charts for a while and they have teased us along the way with magic saves month after month. But since they are monthly and quarterly charts one has to recognize that the math is straightforward and its clinical results are showing one startling conclusion for bulls: Utter Doom.
The market is broken and it requires a very specific set of actions on the charts to avoid doom. But here is the problem: All of market history shows that this doom may not be avoidable.
The specific issue: Following the monthly and quarterly closes we now have MA crossovers. They are clean, they are deep and they are saying this: Unless these MAs get saved this market is going lower. A lot lower.
In 2000 and 2007 these crossovers produced moves toward the lower quarterly Bollinger bands.
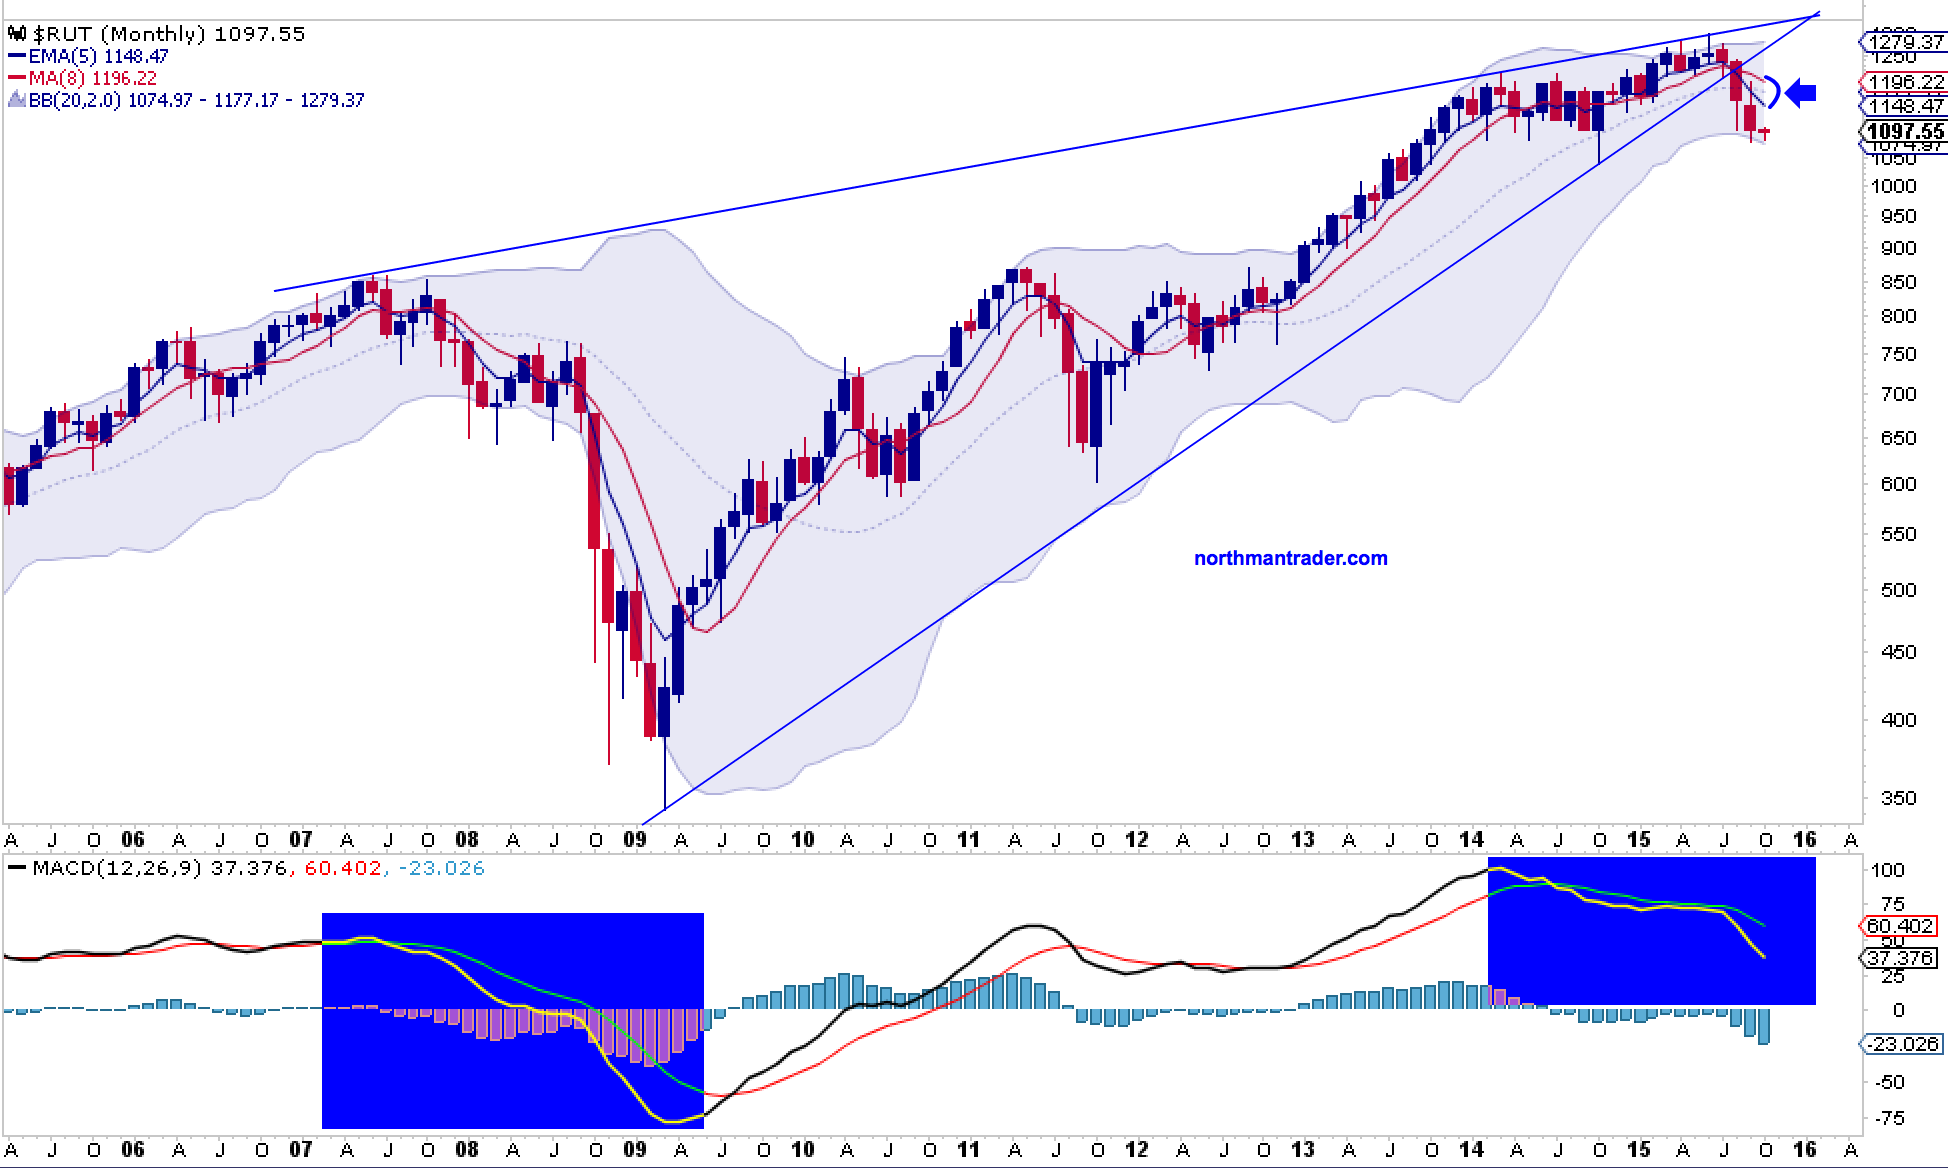
You all have seen the monthly chart:
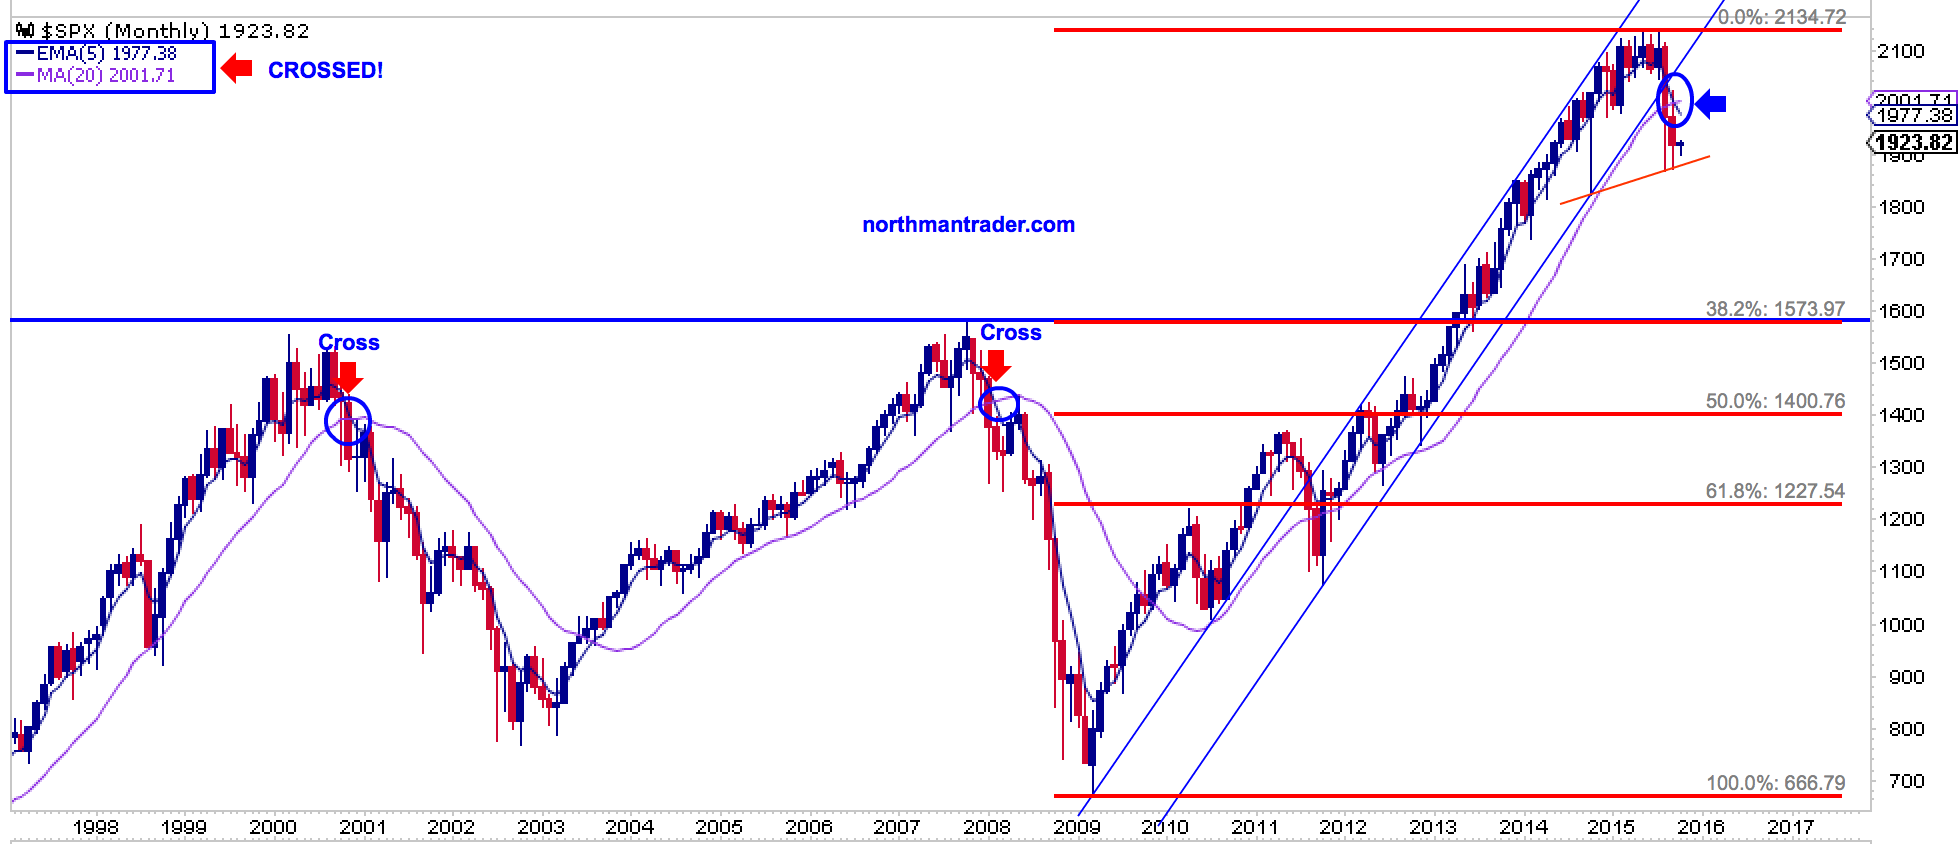
It’s a break. The same break has occurred in 2000 and in 2007.
But here now is the quarterly chart:
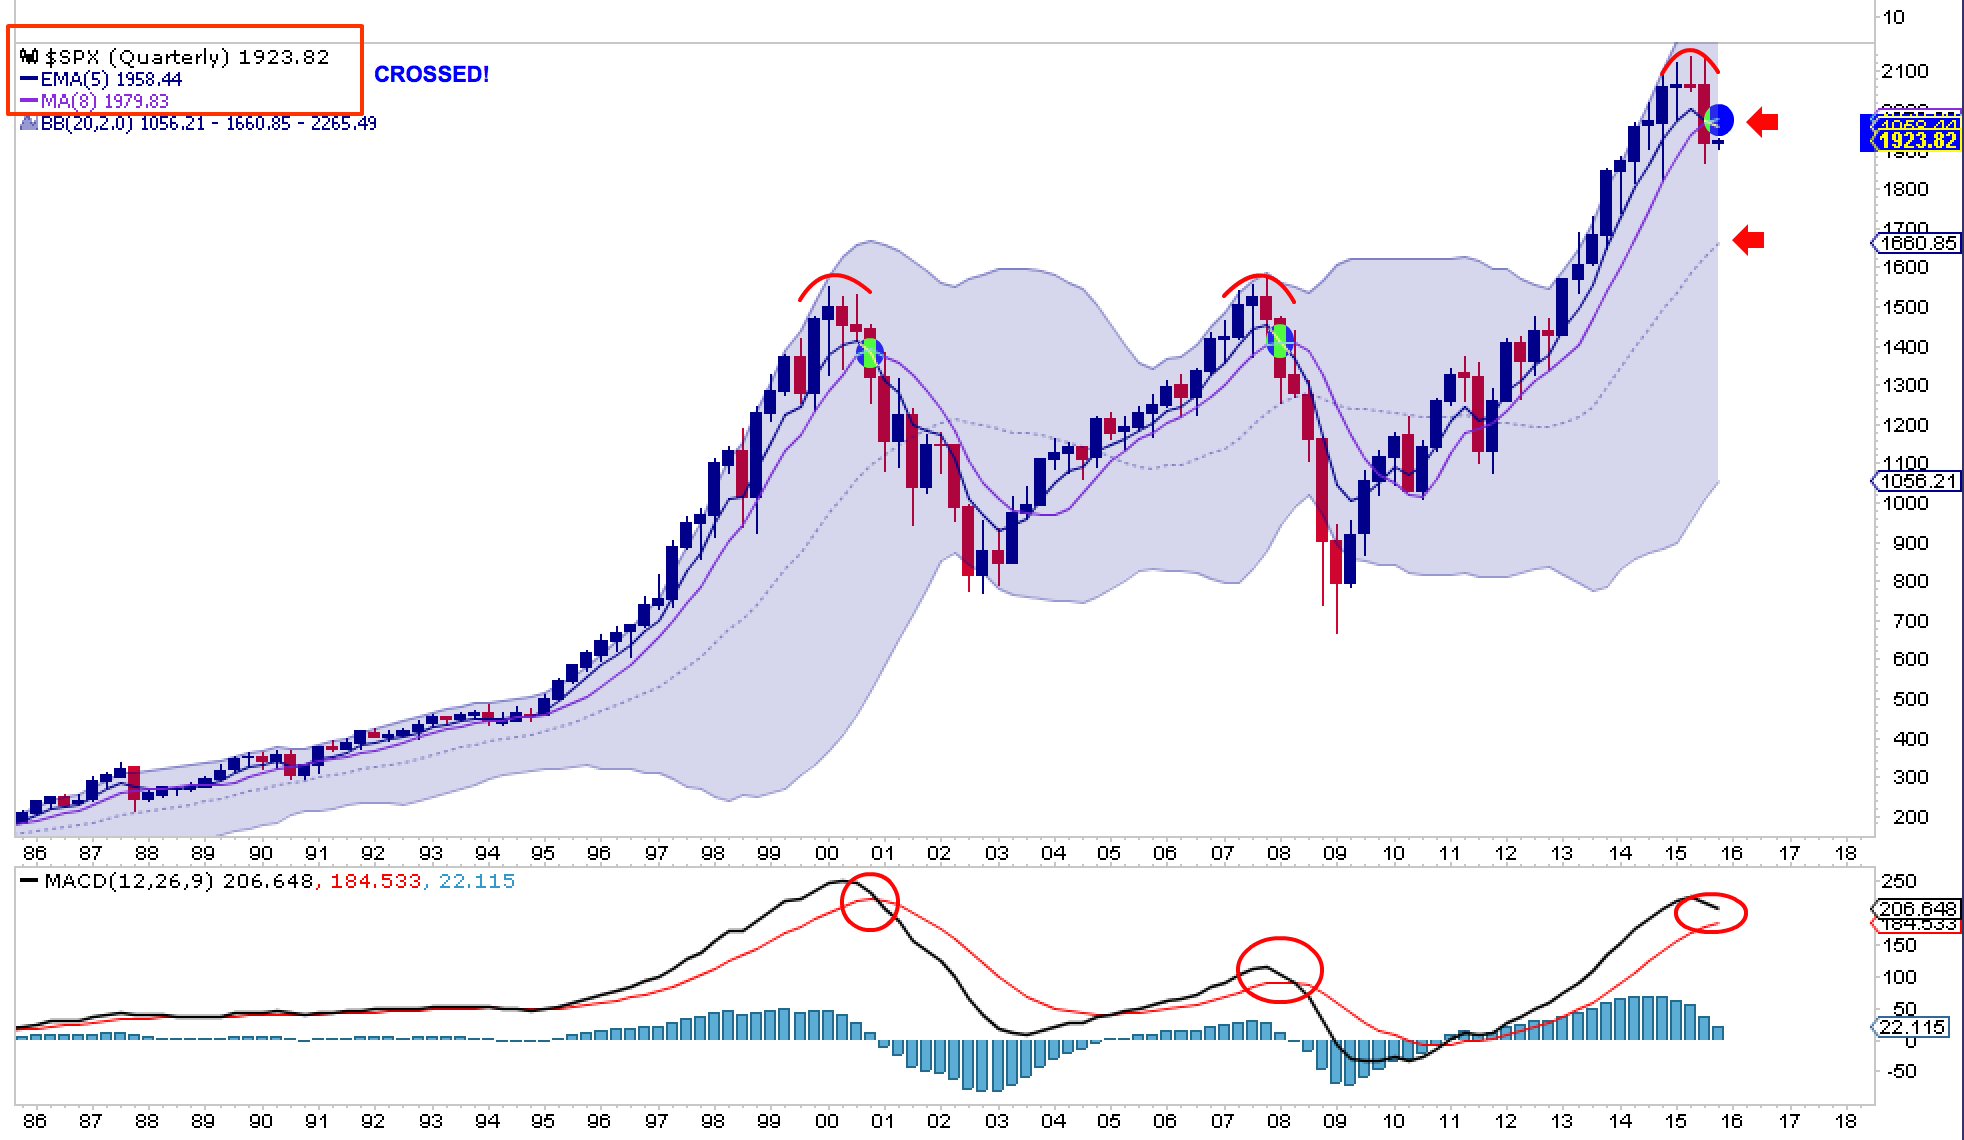
Rounding top, MA break, retest of MAs and then DOOM, first to the middle quarterly Bollinger band, then an eventual decline to the lower Bollinger band. In short: A massive raging bear market.
In both cases central banks were able to light a fire with easing policies and push these markets higher with low rates and easy money. The issue this time: They are already all in and rates at zero.
Further supporting the reason for major concern here is the long term structure of the $VXO:
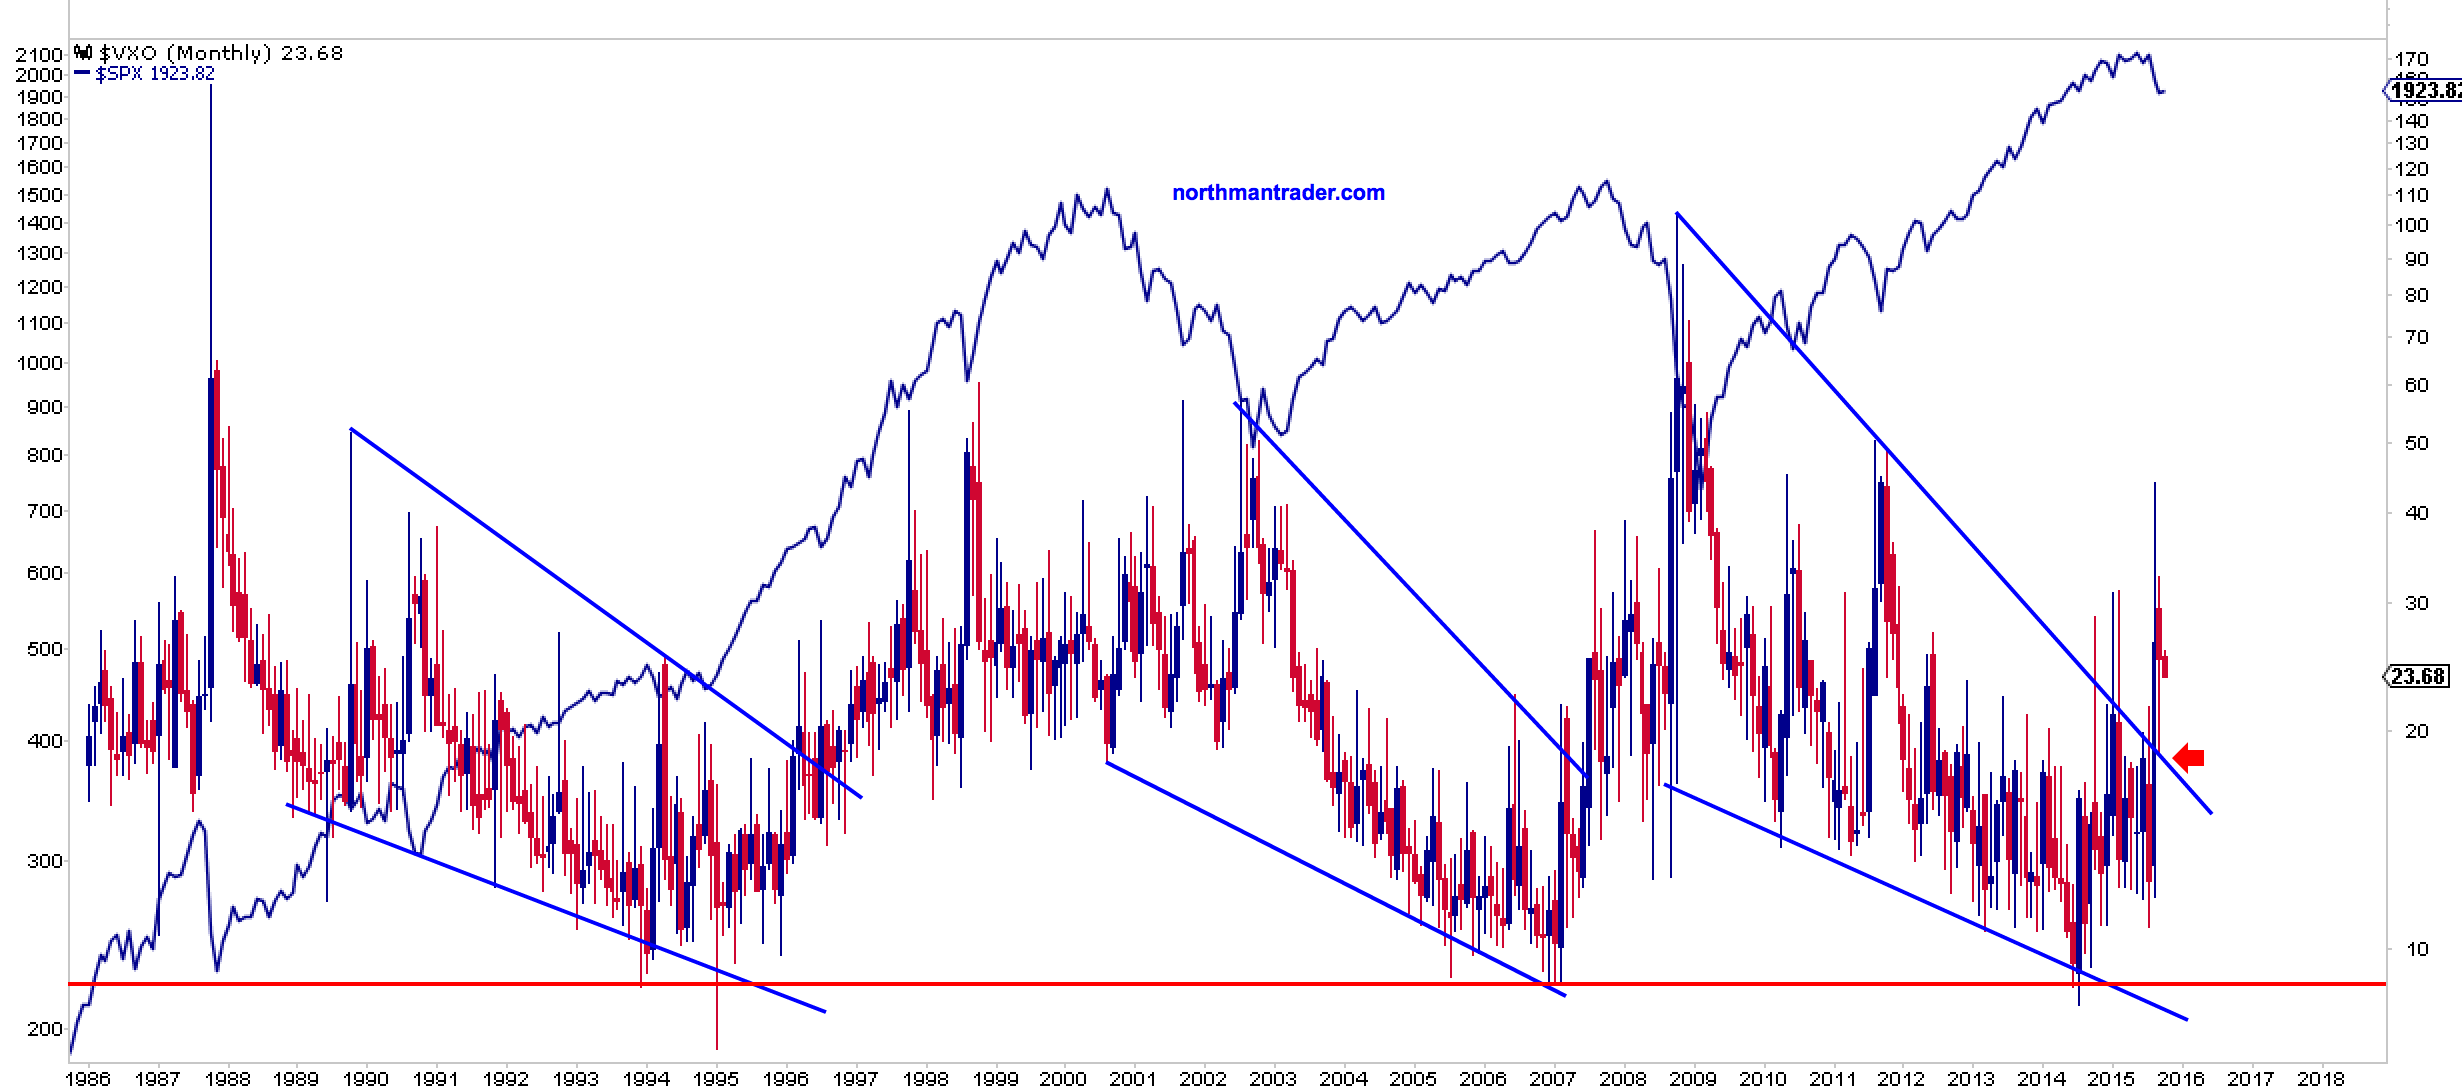
What does this all mean? To me it says this: Unless $SPX can get back above the monthly 20MA (currently 2001.71) and invalidate the descending wedge on the $VXO then this market is done and is heading toward a full fledged bear market. And with central banks already all in it is entirely unclear how it can be prevented or stopped. Perhaps delayed with another desperate QE program, but no, these crossovers are bearish any way you cut it or slice it.
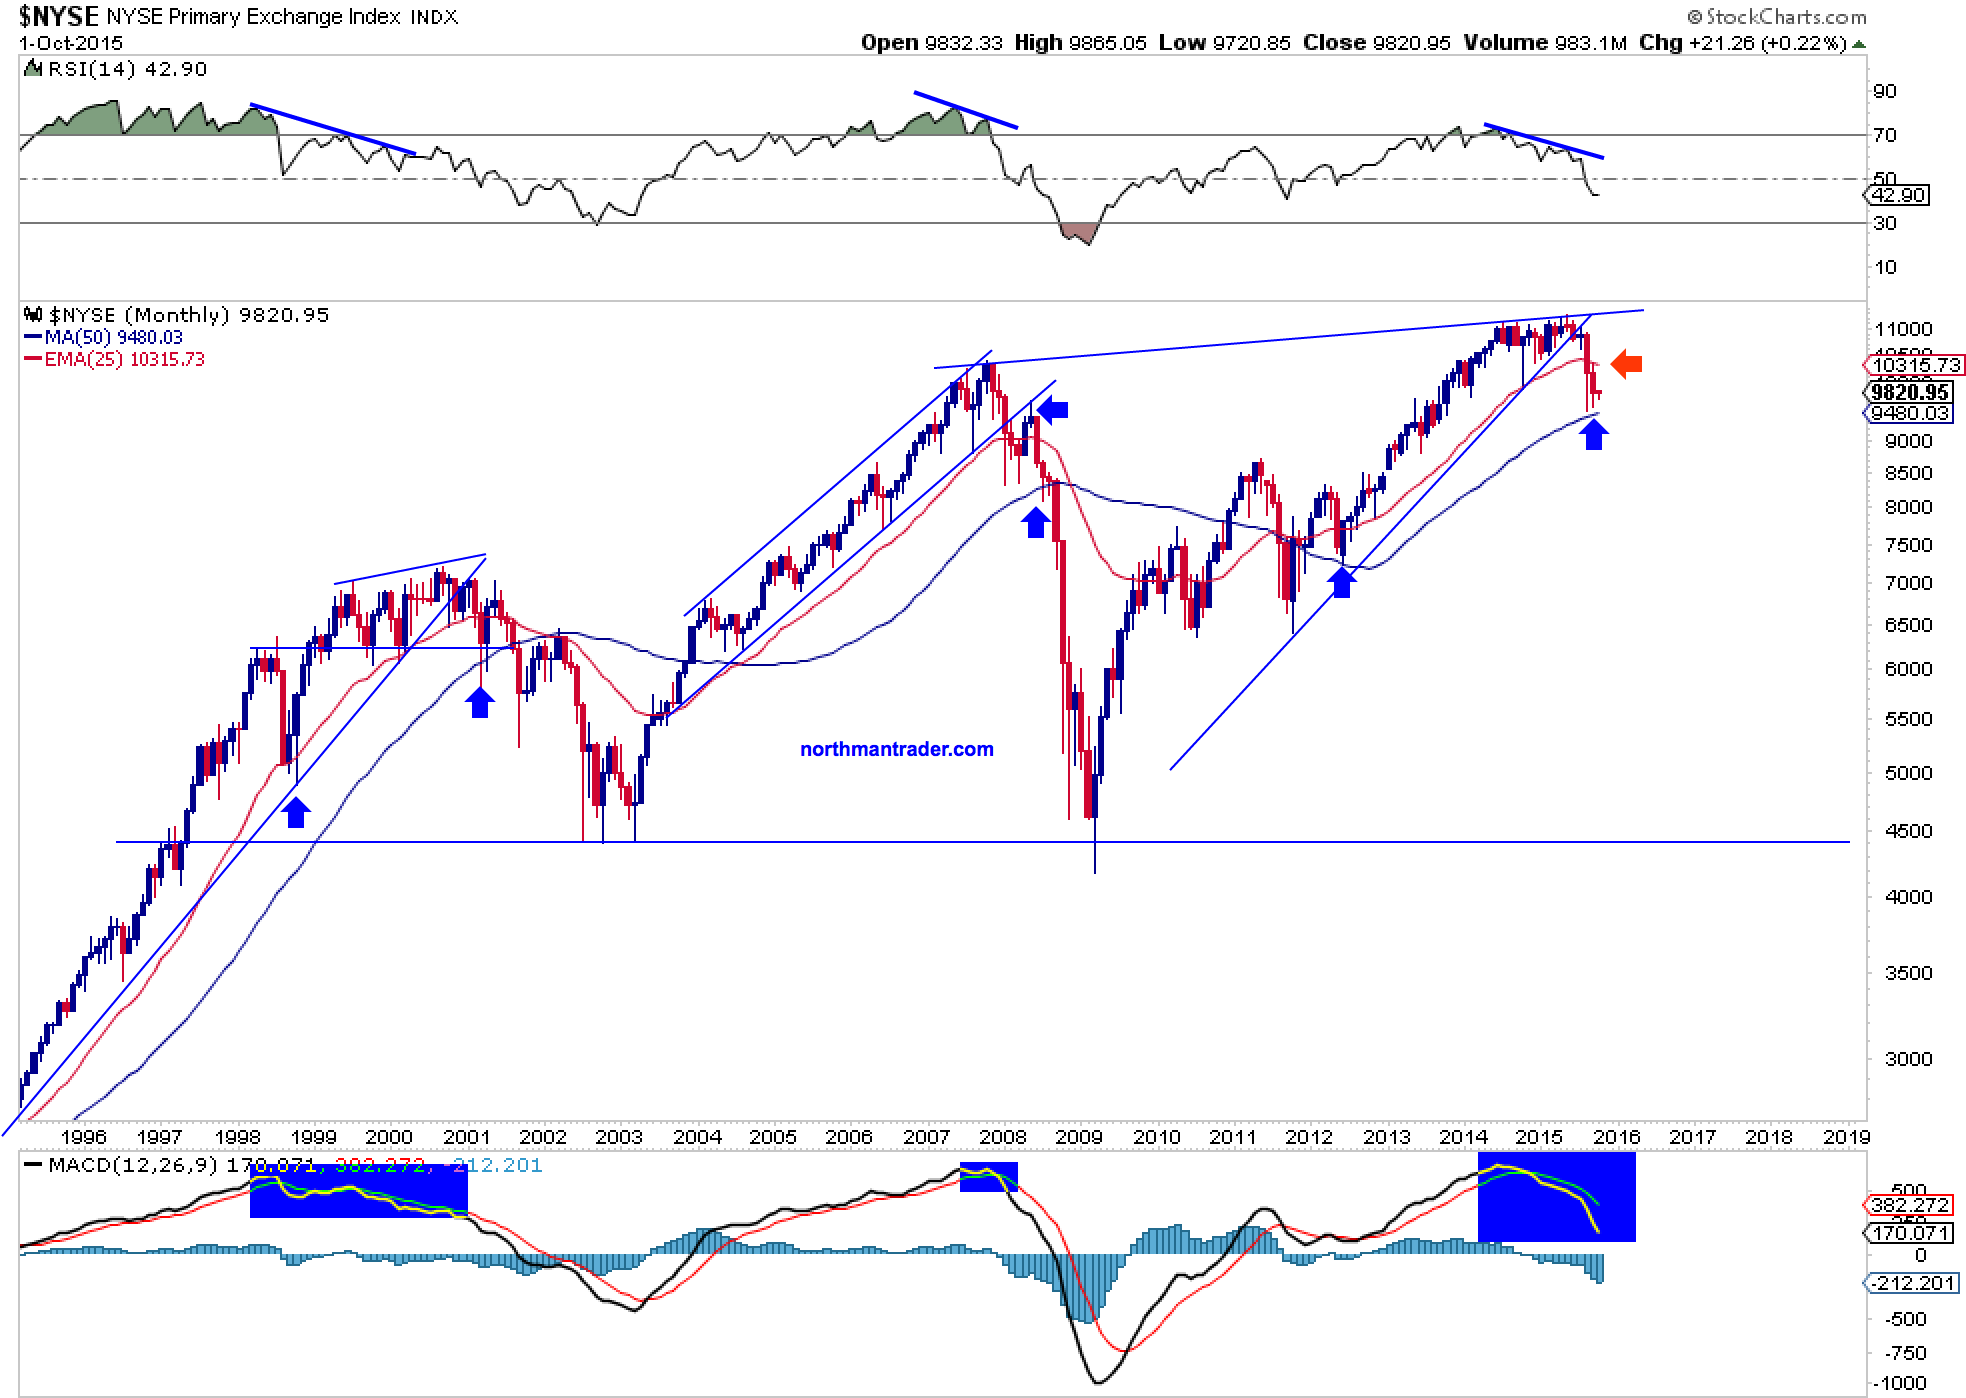
The next rally hurrah tagging key MAs will be the decisive battleground that will determine this market’s future for years to come. It either will defy history or it won’t:
What does the annual chart say?
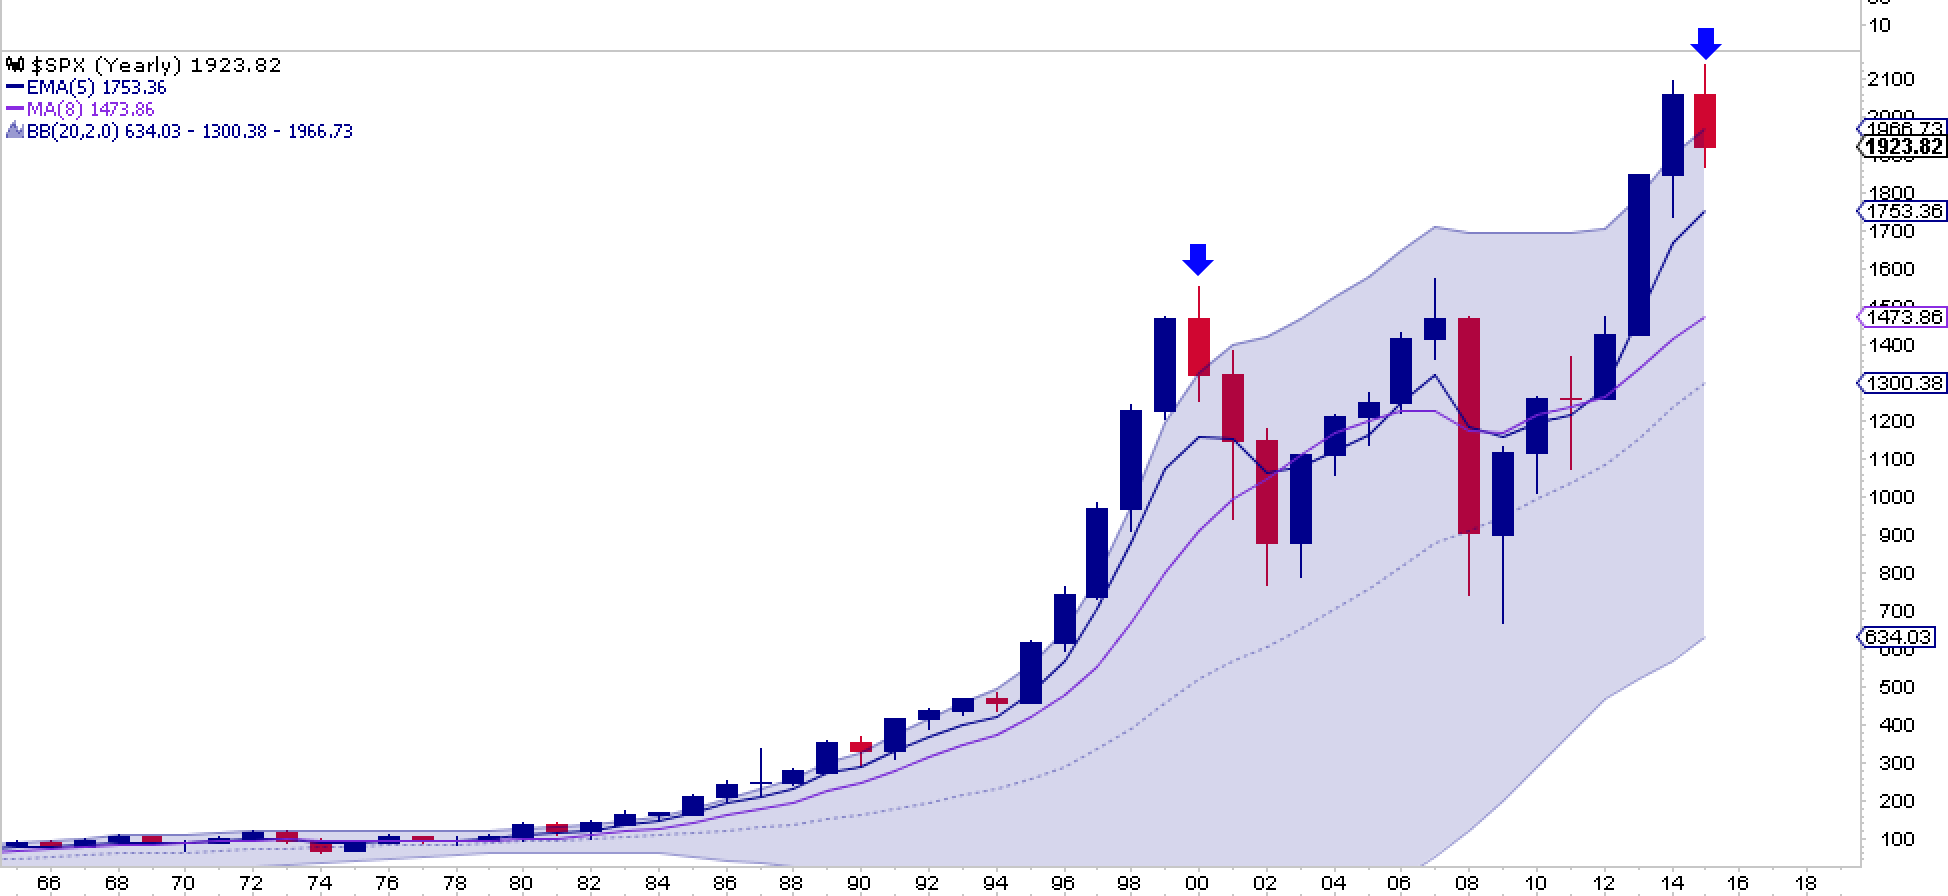
To me it says: Buckle in.
