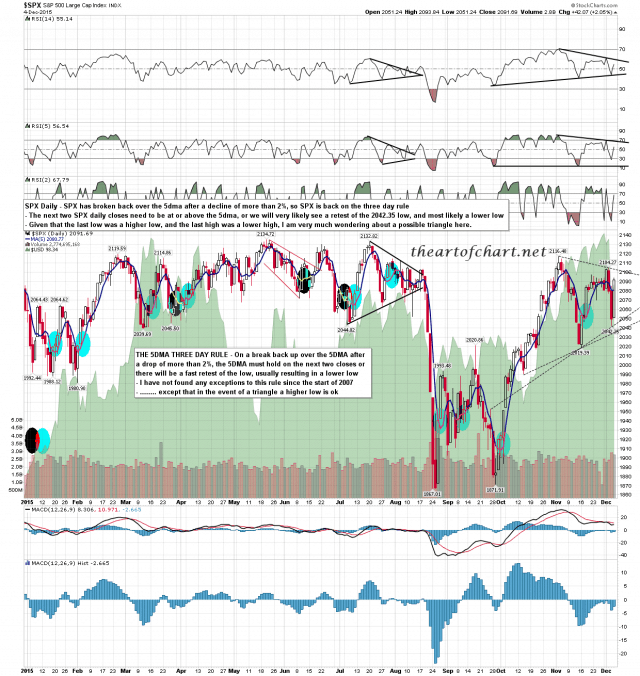
Three trend days in a row last week. It’s been a while since we saw that. The turbulence may well continue. We were looking at it in Chart Chat last night and that is posted for all on the front page at theartofchart.net. Bottom line is that we are expecting a little higher this week, possibly a bit over 2104, and possibly bit under 2104 if a triangle is forming. After that we should see another move down.
SPX broke back over the 5dma on Friday so SPX is back on the 5dma Three Day Rule. A close below the 5dma either today or tomorrow make a retest of the 2042 low this week very likely, though it might be a slightly higher low is SPX is forming a triangle. We may well be forming a triangle here and I’ve drawn that, and the RSI mirror pattern, on the chart below. SPX daily chart:
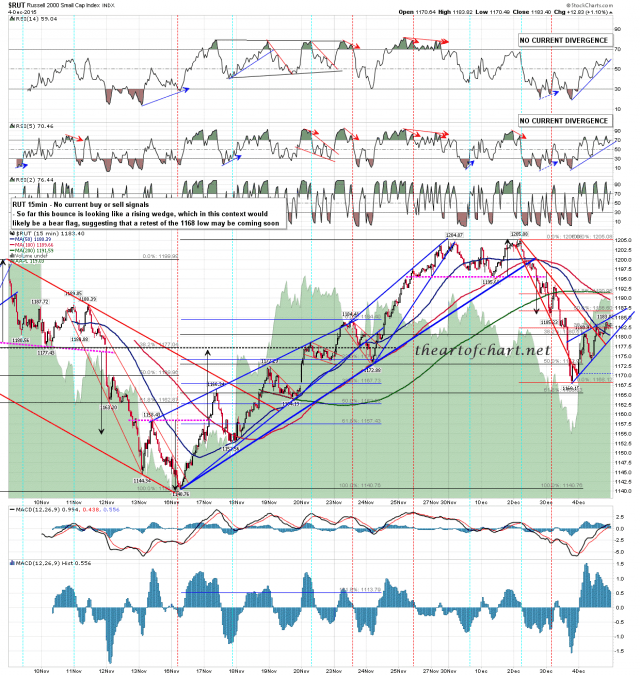
RUT is a decent fit with this scenario. There is unfinished business at least into a retest of last week’s low, and the move from the low is looking like a bear flag. RUT 15min chart:
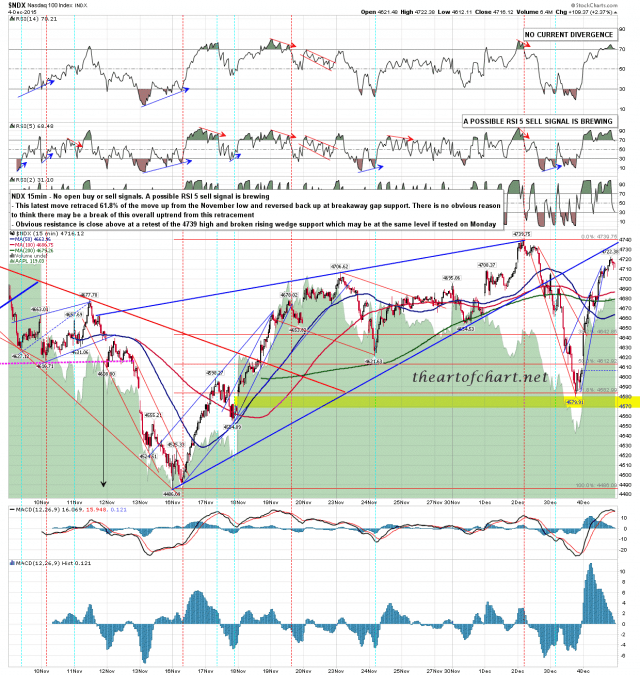
NDX is approaching a retest of major resistance in the 4739 high area. NDX 15min chart:
I really like the triangle option here on SPX though Stan is not so keen on it. If we see a hard fail just under the 2104 retest then that will boost the triangle scenario. I am assuming that we won’t see a fourth straight trend down day today, as that would be taking strange tape to a whole new level. Never say never though.


