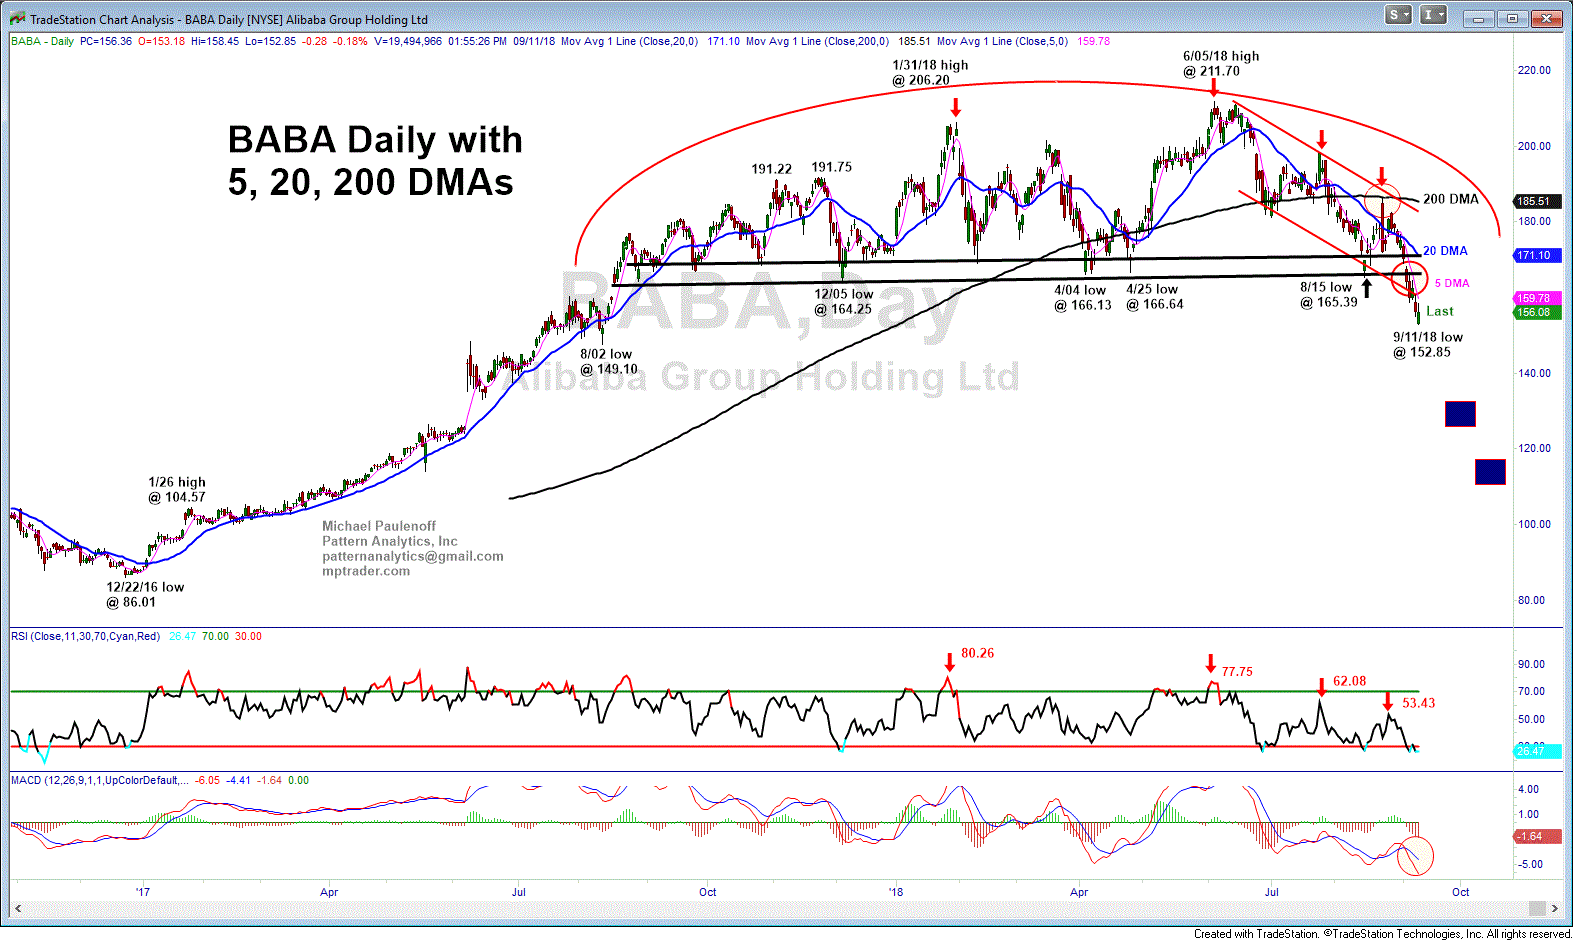
On August 22, when BABA reported strong earnings, I noted to members that “lousy technical price action” saw the initial 4% gain in reaction to the news give way to a 5% downside reversal.
I wrote: “The interesting aspect of the downside reversal is that the intraday high smacked into key resistance at the June-Aug resistance line AND the horizontal 200 DMA, both in the vicinity of 186.60. This is very negative technical action, and indicates to me that all of the action in BABA from the 8/15 low at 165.39 to today’s high at 186.50 represents a completed recovery bounce, and the initiation of a new downleg that should break the 165.39 low, which could unleash a very powerful decline towards 130-125. Last is 174.35/50.”
Fast-forward to Monday and today (September 10 and 11), and we see on my big-picture chart of BABA that it has broken down to a new reaction low at 152.85 so far, continuing last week’s decline that sliced below a MAJOR year-long support zone at 164.25 to 166.60 (indicated in our 8/22 discussion).
BABA finds itself in a very negative technical position as it presses lower and away from the year-long former support zone (now resistance) that triggers downside projections into the 130 to 125 optimally, and possibly to 117 to 112 thereafter.
Any forthcoming strength will hit a wall of resistance starting at 163 that extends up to 172. To hurdle such a massive resistance zone, BABA will need to announce new, bullish fundamental catalysts within an increasingly overbought environment for technology in general, and in the Chinese consumer internet space in particular.


