
SPX came within three points of the daily middle bollinger band on Wednesday so that is no longer a target. ES broke over the strong resistance area at 1386-8 after the close on Wednesday and consolidated above it for much of last night so that is now key support.As I've mentioned before there are some serious resistance levels just above and on the daily chart they are in the 1394 area at the middle bollinger band (often closing rather than intraday resistance) and the intersection around 1400 of declining resistance and broken rising wedge support from the October 2011 low:
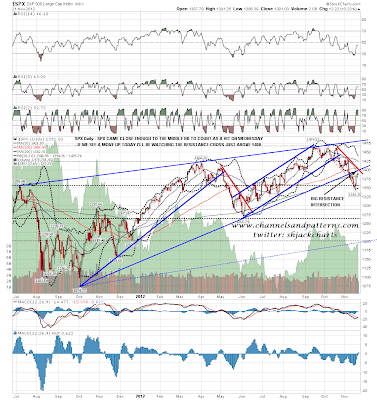
On the SPX weekly chart there is a target above there at the weekly middle bollinger band at 1411. This is a high probability target unless we are in a new bear market, but this doesn't need to be hit now of course. This just requires SPX to stay ten points or so above the weekly lower bollinger band, now at 1347, before the next hit of the middle band:

On the SPX 60min chart I have three important levels not far above.The first is a decent support/resistance level in the 1396.5 area, the second is declining resistance (mentioned earlier) in the 1400 area, and the third is the neckline of the possibly failing H&S in the 1405 area. These are all decent resistance levels and make longs here look rather unappealing. SPX has broken over the obvious IHS neckline but could still form an upsloping IHS from a reversal at declining resistance. The seasonal stats for Wednesday and today are bullish but the stats for Monday are bearish of course:

I'll also post the NDX 60min chart today. I mentioned during the decline that there was a decent declining resistance trendline there and a break above would look bullish. That trendline is now very close and we may see a test today. That trendline also intersects a significant support/resistance level (and possible IHS neckline) today and I'll be watching that. As with SPX there is clear negative RSI divergence and we may well see reversal there:

On other markets EURUSD has broken up from the broadening descending wedge I was showing on Wednesday morning, and the alternate (much better) resistance trendline that I noted on that chart has been confirmed after the break, so the quality of that pattern is now much improved. This is unambiguously bullish, though 60min RSI divergence and the resistance trendline I have marked on the chart have me looking for short term reversal. I've marked in a possible target slightly above the key support level at 1.28:

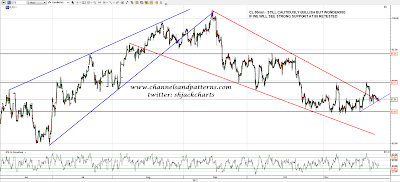
CL has been limping along but the overall setup still looks cautiously bullish. If the short term support trendline I have marked in breaks however, I'll be thinking seriously about a retest of strong support at 85, which would be an attractive long entry if we see it. It's worth mentioning again that this falling wedge could still break downwards with a target in the 60-5 area, so if we saw a clear break below 85 that would be a warning signal to take seriously. On a break over 90 I would see a run to 94.3 as very high probability:
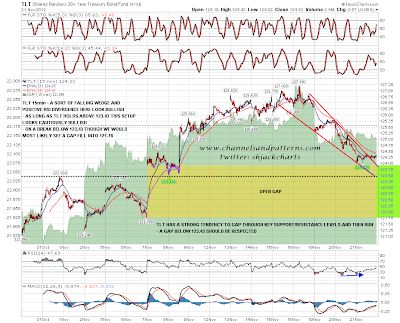
TLT has broken slightly below my target support trendline on the 60min chart so I've been having a careful look at the 15min chart. That looks cautiously bullish with an ok quality falling wedge that has broken up on positive RSI divergence. If we see more weakness I'd lie to point out the important support level at 123.43, and the open gap extending through that into the 121.78 area. A break below 123.43, particularly on a gap below it, would be a bearish signal that should be respected:
One of my favorite traders is Eubie (Stephen Eubanks) at Mr Topstep (MTS). He's the short term reversal specialist leading the ES trades in the MTS trading chatroom, of which I have been a member for over a year now. He has a number of catchphrases. One of those is 'It's not staying here long' which I used as a title on Wednesday, and another is 'This ain't the Guggenheim', meaning that rather than just watch at key levels, opportunities there should be taken. Usually that's right, but today is a Guggenheim day in my view unless we see a clear break below the key 1386-8 level on ES.
At the time of writing ES has clearly broken above there, but there is so much resistance not far above, the trading day today is so short, and the stats for the Monday after Thanksgiving are so negative, that taking a long here looks unappealing, and taking short positions just above key support levels tends to be a bad idea. A hat tip to Eubie today for his hard work and many excellent calls, and I should mention that Eubie also has a twitter feed which you can follow here.
