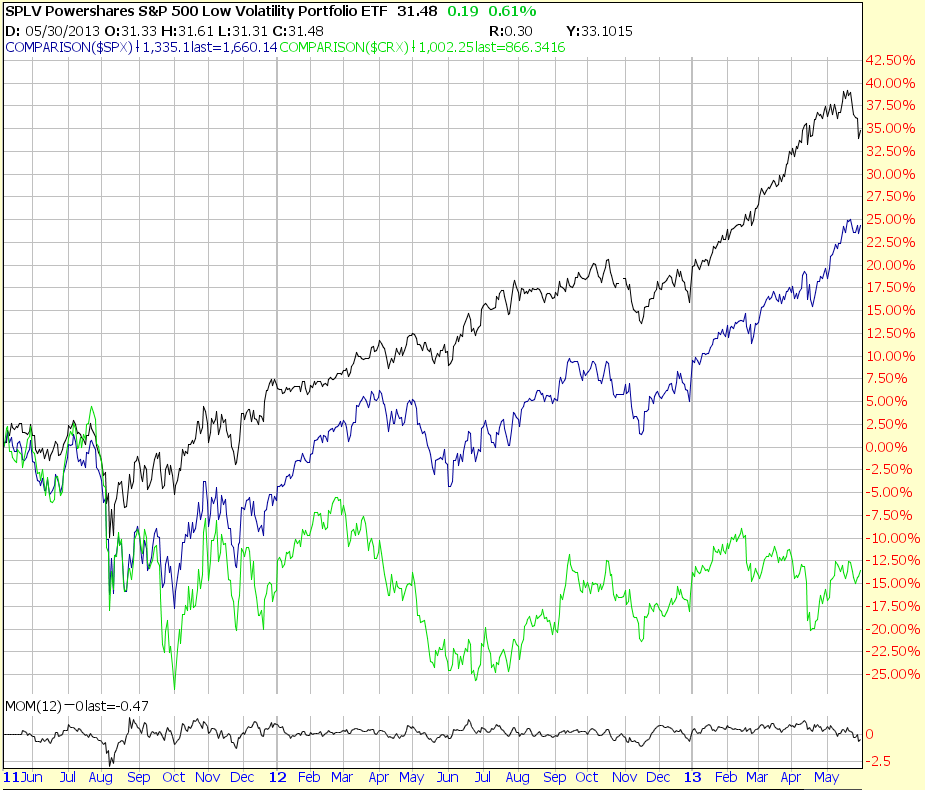
This Daily comparison chart of the SPLV (which is an ETF containing the top 100 lowest-volatility stocks in the S&P 500 Index) with the SPX shows that they have traded pretty much in tandem since the ETF’s inception.
However, that correlation diverged in mid-May and the SPLV has now made a lower closing swing low on this timeframe. Furthermore, the Momentum indicator has dropped below the zero level signalling potential further weakness ahead.
We’ll see if the SPX follows and pulls back on any further SPLV weakness.

Now, if we throw the Commodity Index (CRX) into the mix, we can see that it, too, is still diverging from the SPX, as I’ve written about most recently on May 23rd.
We’ll see if an all-out bull market resumes in both equities and commodities any time soon (and potential parabolic move on the SPX), or whether we’ll now see a pullback or correction in both, as the negative divergences in the SPLV and CRX are indicating.