Slope of Hope Blog Posts
Slope initially began as a blog, so this is where most of the website’s content resides. Here we have tens of thousands of posts dating back over a decade. These are listed in reverse chronological order. Click on any category icon below to see posts tagged with that particular subject, or click on a word in the category cloud on the right side of the screen for more specific choices.
Hello, I am EFA. Won’t You Please Short Me?
Quadruple Witching Day (by Springheel Jack)
In a variant of the 'dog ate my homework' line at school I'm inclined to blame the security council last night for messing up a very nice IHS that was forming on the oil chart. All is not lost however, as oil has reversed at an alternate sloping neckline slightly higher, and I'm watching to see whether oil will now put in a right shoulder for the pattern:
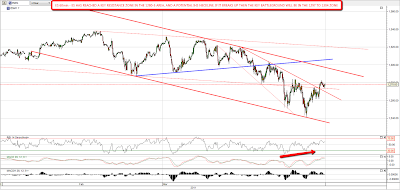
Copper broke up yesterday I was thinking it probably would, and rose to 437.6, just under the 438 target I gave yesterday morning. I picked that target primarily as a potential IHS neckline, and if the IHS continues to form I'd expect a retracement to the 426.5 area before the next move up:
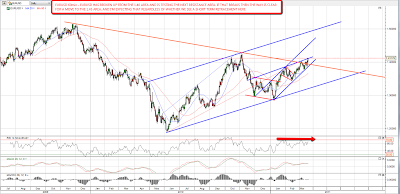
EURUSD has broken up from the 1.40 area and is testing the next resistance trendline just over 1.41. It may pull back slightly there, but regardless I'm looking for a move soon to the 1.45 area. The USD support trendline from 2008 is now broken I think and I'm no longer expecting that to provide any support:
So far, so bullish, and I'm not seeing anything here to undermine my view that we've just been seeing a correction within a greater bull wave up. Has that correction bottomed yet? Possibly, though we've not seen a classical low with positive RSI divergence on the SPX daily chart. I'm somewhat discouraged by the fact that my bullish EW chum Pug has already called the low and has no alternate count for a new low, but I'm still looking for that classical low unless the daily 50 SMAs are broken on SPX and NDX, and those are at 1302.77 and 2319 respectively today. Why the daily 50 SMAs? Well they're a good line in the sand, and John Murphy has given those as his bull trend change markers. They are also close to key resistance levels on both indices and fit well with my futures charts.
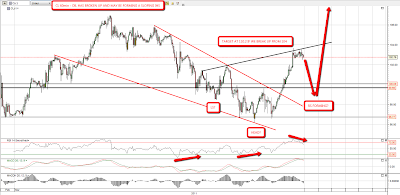
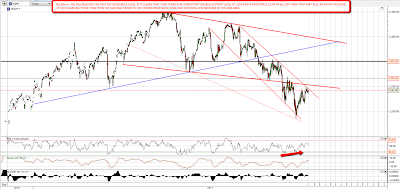
I gave 1283 as the likely target on ES yesterday morning, and I see that ES topped at 1282.50 overnight. I gave this target because it is a potential IHS neckline and strong resistance zone, and if we aren't to see a new low on SPX, there's nonetheless an excellent chance of seeing an IHS form. The left shoulder for the pattern bottomed at 1251 and we could fall from here to form a right shoulder now. If ES can clear this zone then I have declining channel resistance at 1296.5 and strong resistance (and another potential IHS neckline) at 1303.5. If ES reaches the neckline at 1303.5 I would see the correction as very likely to be complete, but with a strong chance of retesting the 1280-5 area before breaking back up through 1300:
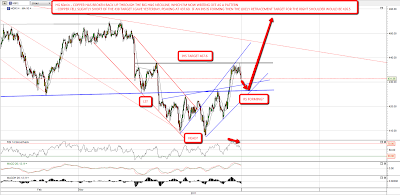
I gave 2254 as the likely NQ target yesterday, and it fell slightly short at 2251, but I overcalled the target slightly as NQ has hit my declining resistance trendline that is the first key resistance level. The next resistance is a broken support trendline at 2253, and then a resistance zone and potential IHS neckline in the 2267 area. If NQ manages to clear all of these then the natural target is the strong resistance zone and potential IHS neckline in the 2300 area:
I'm leaning towards seeing equities trade sideways today and perhaps Monday because to form the classical low I'm looking for a multi-day bounce is required to reset the daily RSI. There's strong resistance here on ES and NQ, and we may clear it to rise further, though we may just trade sideways for the next day or two.
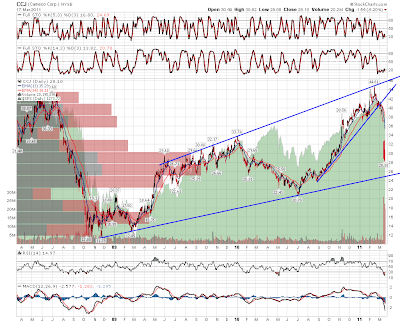
Lastly for today I'd like to post an individual stock chart that I've been looking at, and that's the chart for Cameco, the uranium miner. Now there's been some talk that the nuclear problems in Japan might lead to another lost decade or two for nuclear power, but I think that's garbage. Nuclear technology has moved on a lot since the Fukashima plant was built in 1970, and in the era of global warming nuclear power will have an important place, albeit that the nuclear power stations of the future may run on thorium rather than uranium. Cameco is approaching the main support trendline in the 25 area, and that would be a good long entry IMO if it is reached. If that trendline breaks though I'd be inclined to sell, as it's hard to see then where CCJ might bottom out:
I'm leaning neutral today and am watching my resistance trendlines on ES and NQ.
