
There was a very large move overnight as the EU eased repayment rules for EU banks, and announced a $149bn plan to promote regional growth at the EU summit. Much has been made of Merkel's isolation at the summit and I was reading this morning that French President Hollande won't be backing down on his demand that Germany back a Eurobonds plan, so it seems that risking future German bankruptcy is a risk that the (ahem) French are prepared to take. We'll see how that goes today, but given that unconditional agreement by Merkel looks like political suicide at home, that she stated earlier this week that no such agreement would be reached in her lifetime, and that it would most likely be ruled unconstitutional by German courts in any case, it seems unlikely that Hollande will get his way.
What we might see however is German agreement to a Eurobonds scheme conditional upon Euro members surrendering a lot of fiscal sovereignty to, in effect, Germany, and that might have the potential to kick any major crisis a few months down the road. We'll find out what has been agreed over the weekend.
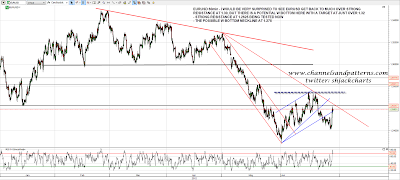
Short term EURUSD has bounced strongly, and is testing resistance at broken support at the January low at 1.2625. There is a potential W bottom in play on a break over 1.275, and that would have a target just over 1.32 at almost a full retracement of the move down since the beginning of May. If some sort of Eurobonds agreement is hammered out today then that is a possibility, but declining channel resistance from 2011 is at just over 1.30 and I would be very surprised to see that broken:
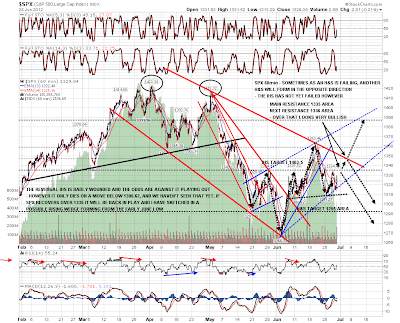
Looking at the SPX daily chart the middle bollinger band was held again and on a break over 1335 resistance then the next obvious targets are the 100 DMA at 1359 and the upper bollinger band at 1365:

On the SPX 60min chart my possible rising wedge support was pinocchioed at the low yesterday but held. The key resistance level is at 1335, but with ES at 1342 as I write, we will most likely see a gap up over that at the open, at which stage it should become support. Declining resistance from the high is at 1352 SPX this morning and a break above that would look very bullish, and open up a test of the current rally high at 1363.46. On a move above 1335 the IHS target in the 1403-5 area is back in play:
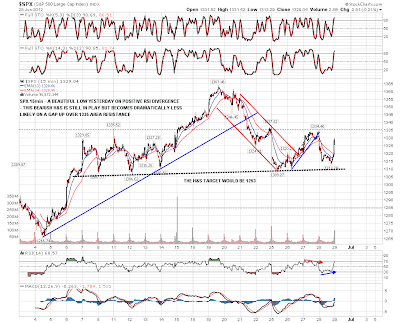
There was a beautiful low on the SPX 15min chart yesterday on positive RSI divergence. Sadly I missed it as I was out watching my daughter in a musical version of A Midsummer Night's Dream. The bearish H&S on this chart is still potentially in play but becomes dramatically less likely to play out on a break over 1335 SPX, which looks almost certain at the moment:
I've been watching oil and silver very carefully over the last few days, and I want to explain why I think these are so important. On silver we are seeing a test of very strong support just over 26. I thought that rising support from the 2008 low had broken yesterday, but after a very close look at this again this morning, the test there was yesterday. This is very strong double support for silver and it may well hold. If it breaks however, it would be a massive support break and I would be looking for a test of the next strong support level at 19.5 – 20, and possibly lower:

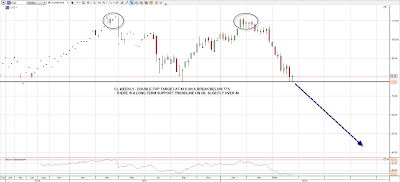
On oil the setup is a very nice looking double-top on CL, with the neckline or valley low being tested at the moment. The target on a break below 77.5 would be 43.5, and I have the main bull market support trendline for WTIC, with three touches from 1998, 2001 and 2009, at just over 40, which gives that double-top target on CL some serious technical weight:
I'm seeing these tests on silver and oil as the key line in the sand for what happens across most of the commodity complex over the next few months. There's a good chance they find support here, but on a break below the outlook looks bleak.
I have an example to show illustrating what often happens after support breaks of this magnitude. I did a post in May last year on RIMM after RIMM broke key support from 2005. You can see that post here. I said that the break was a very bad sign and had a lot of comments that RIMM was a good dividend stock, with strong earnings and well established markets etc etc. Here is the chart I posted then:

Here's how the RIMM chart looked at the close yesterday, after a fall of some 80% from the date of that post:

What is the take-away from these RIMM charts? It is that regardless of what you think of the fundamentals, a major technical support break is a very strong signal to, at absolute minimum, exit immediately. We'll see whether silver and oil hold support or break here, but on a break, there is huge potential further downside that may well play out.
As I've been writing ES has climbed to 1347.75, and EURUSD has broken over 1.2625, and we may therefore see rising support in the 1352 SPX area broken at the open. That would be very bullish, I wouldn't expect to see a retracement below 1335 before at least a test of the current rally high over 1360, and on a break over the current rally high at 1363.46 SPX the IHS target at 1403-5 will be fully back in play. Be very careful shorting into this today.
This rally may however be short lived if there is no Eurobonds agreement at the EU summit today.
