Further to my last Weekly Market Update, this week’s update will look at:
- 6 Major Indices
- 9 Major Sectors
- 30-Year Bonds
- U.S. $
- Emerging Markets ETF (EEM) and BRIC Indices & ETF (BKF)
- Germany, France, and the PIIGS Indices
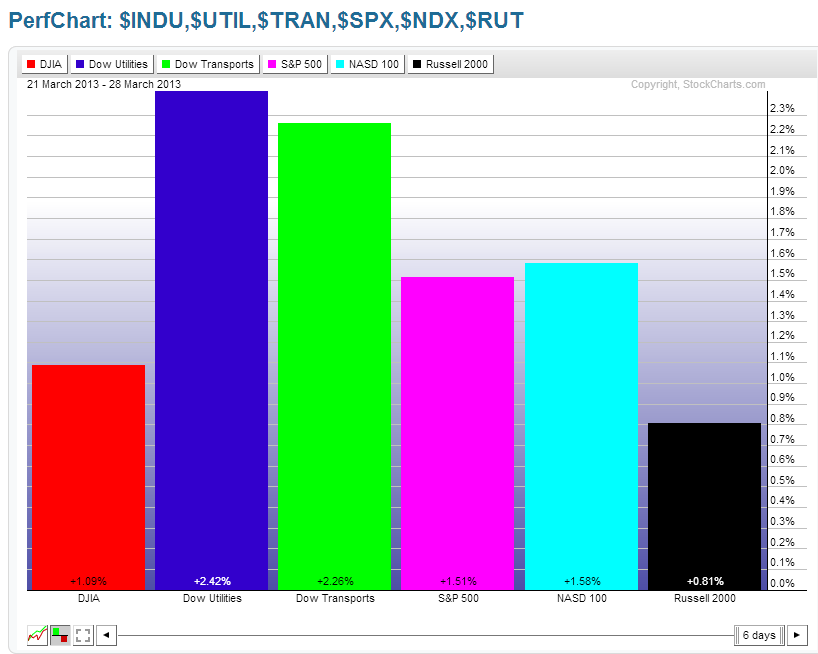
6 Major Indices
As shown on the Weekly charts and the percentage gained/lost graph below of the Major Indices, the largest gains this past week were in the Dow Utilities, followed by Dow Transports, Nasdaq 100, S&P 500, Dow 30, and Russell 2000.
The Indices remain (technically) in overbought territory on their Weekly and Monthly timeframes, which may be viewed as overvalued to some and bullish to others.

9 Major Sectors
As shown on the Weekly charts and the percentage gained/lost graph below of the Major Sectors, the largest gains were made in Health Care, followed by Utilities, Consumer Staples, Cyclicals, Energy, Industrials, Technology, Financials, and Materials. There was a bigger appetite for the ‘Defensive’ Sectors as the S&P 500 approached and finally closed above its all-time closing high.
The Sectors also remain (technically) in overbought territory on their Weekly and Monthly timeframes, which may be viewed as overvalued to some and bullish to others.


30-Year Bonds
The 5-Year Weekly chart below of 30-Year Bonds shows that price continued its bounce from the prior two weeks and is sitting just below major resistance. A break and hold above resistance may coincide with profit-taking in the Major Indices/Sectors…something I’ll be watching for in the coming week(s). I’d need to see major support below broken and held on increasing volumes before I’d suggest that perhaps big money is finally flowing out of Bonds to be deployed into equities, and/or commodities, currencies, other instruments. However, there may be some drifting out within this current range (in between support and resistance) that is not so apparent because of Fed intervention.

U.S. $
As shown on the 5-Year Weekly chart below of the U.S. $, price closed (once again) above an important convergence of two 60% Golden Fibonacci ratio levels. A break and hold above its recent highs may also coincide with some profit-taking in the equity markets, or serve as a hedge on any further equity rally.

Emerging Markets ETF (EEM) & BRIC Indices & ETF (BKF)
As shown on the 5-Year Weekly chart below of EEM, price is retesting major resistance. A break and hold above may positively influence the ‘riskier’ Sectors, while a break and hold below major support [the confluence zone of the 50% Fibonacci level, 50 and 200 smas (note the bearish ‘Death Cross’ formation on this timeframe as price is still subject to its bearish influences), Volume Profile POC, and lower Bollinger Band] could produce a drag on any further equity rally…an important ETF to watch going forward.

You can see on the Daily thumbnail charts below of the BRIC countries and ETFs, that those Indices/ETFs are attempting to rally from or near to a support level of one form or another.

The following graph shows gains/losses made year-to-date for these countries and ETFs. You can see that Brazil has been battered the most, followed by Russia, and India, while China is basically flat on the year…ones to watch as further weakness in these countries may finally negatively affect U.S. equities.

Germany, France, and the PIIGS Indices
The Daily thumbnail charts below show that Portugal, Italy, Greece, and Spain have broken their uptrend lines, while Germany, France, and Ireland are in the process of testing theirs. Greece looks particularly vulnerable at the moment, as does Italy.

The following graph shows gains/losses made year-to-date for these countries. Italy, Greece, and Spain have suffered the most losses, so far this year, while Ireland has gained the most, followed by France, Portugal, and Germany. Unless the other countries, particularly the southern European countries pick up the pace, I doubt whether Ireland can carry Europe on its own for the rest of the year…also ones to watch, as continuing weakness may produce a drag on U.S. equities.

Summary
In summary, as I pointed out here, the Dow 30 and Russell 2000 have made a new all-time high and closing high, while the S&P 500 made an all-time closing high on Friday (however, its all-time intraday high of 1576.09 remains unbroken and is still serving as major resistance at a formidable triple-top formation and represents an opportunity for some cannibalization, as I wrote about here. The Nasdaq 100 has lagged the other three Major Indices, so far this year, and is hampered by major resistance. However, all four remain in a strong uptrending channel on the 4-Hour timeframe, as I mentioned here and will likely need to be broken convincingly before the trend changes. We’ll see whether the longer-term resistance scenario holds for the SPX to turn it back, or whether the shorter-term uptrend continues to push it up and over major resistance.
The U.S. $ has strengthened, while the Euro has slumped, as I wrote about here. Foreign (and U.S.) markets have been trading erratically, as I wrote about here, here, here, and here. As I’ve mentioned above, they will need to strengthen considerably (otherwise I’d be looking for the ‘Canaries’ to drop, with the others following suit) if a convincing case is to be made that all is well in the U.S. and that now is the right time to be buying stocks, particularly at their current (technically) Weekly and Monthly overbought levels. Brent Crude Oil and WTIC have begun to rally (no doubt in taking advantage of the recent banking and fiscal upheaval in Europe), and I’m watching Brent to see if the spread begins to widen again in favour of Brent, as I wrote about here and here.
Next Friday we have a few data releases, including Non-Farm Employment Change, Trade Balance, Unemployment Rate, and Average Hourly Earnings. Inasmuch as the first three are hinting at some slight economic improvements, wages have yet to make a comeback to the pre-2009 financial crisis levels, as shown on the following graphs. Without seeing much improvement in wages this year, the average consumer may not be so inclined to keep piling on debt as product prices continue upward (which they will do as companies look for ways to keep improving profits, while lowering costs). In that regard, we may see a slow and choppy growth for 2013 on the earnings and economic front…whether the stock market accurately reflects that is another matter, particularly with the Fed pouring gasoline on the fire.

Happy Easter and good luck next week!


