
Further to my last Weekly Market Update, this week’s update will look at:
- 6 Major Indices
- 9 Major Sectors
- Various World Markets
6 Major Indices
As shown on the Weekly charts and the percentage gained/lost graph below of the Major Indices, this past week saw profit-taking in all of them, with the greatest losses occurring in the Dow Utilities.
This small drop on the week, percentage-wise, is hardly surprising, given the highly elevated stance of prices relative to their Stochastics cycle and Bollinger Bands on, not only a weekly timeframe, but also on a monthly Options Expiration timeframe, as I outlined in my last weekly market update, as well as for the reasons mentioned in a variety of my posts this week.
It will take a more substantial pullback to relieve these over-extended conditions…whether we see that next week remains to be seen.


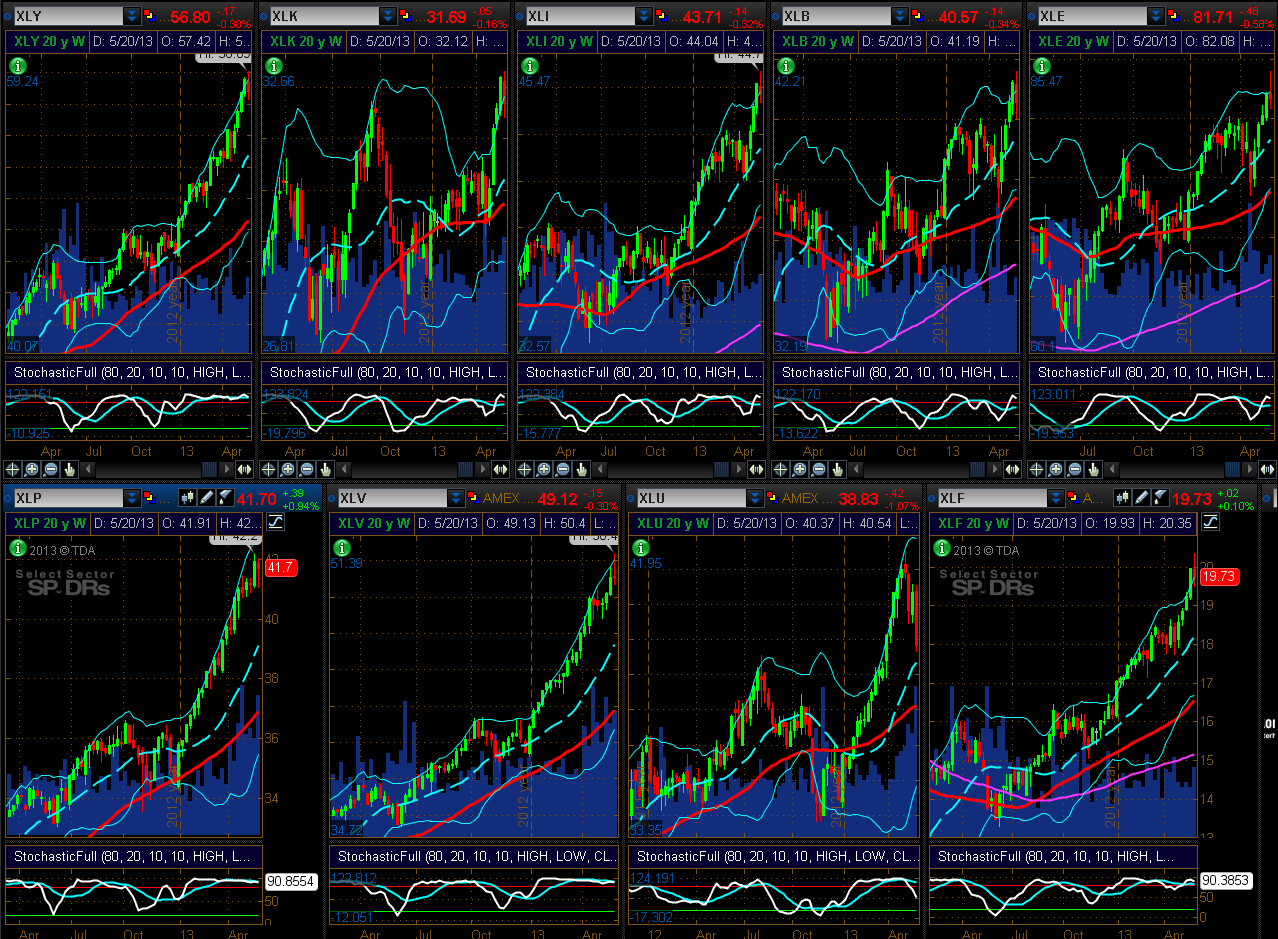
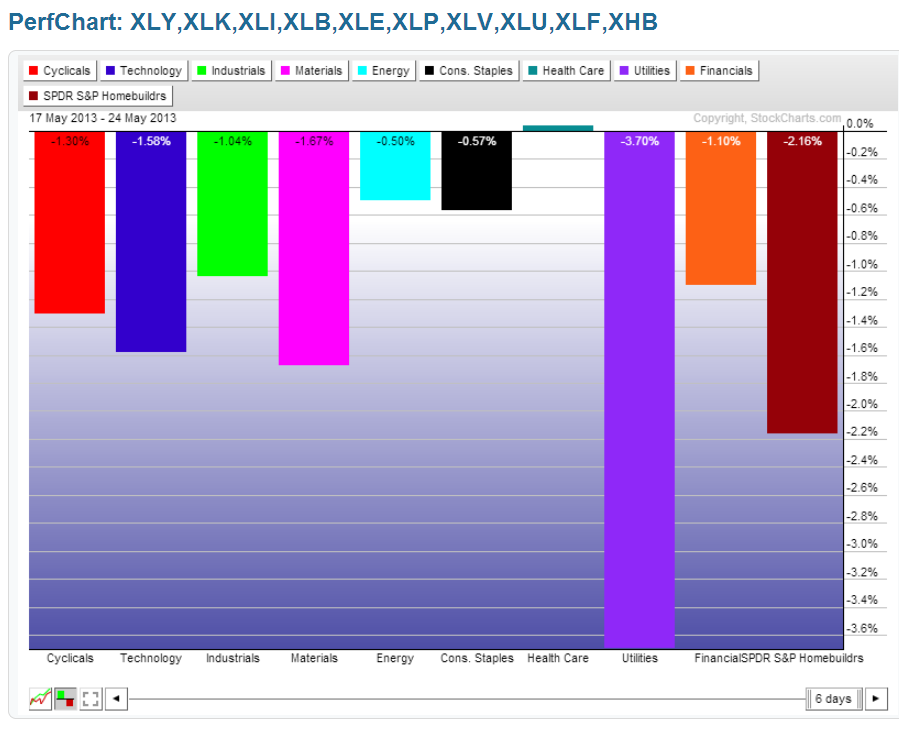
9 Major Sectors
As shown on the Weekly charts and the percentage gained/lost graph below of the Major Sectors, this week saw the largest percentage drop in Utilities. Health Care was flat.

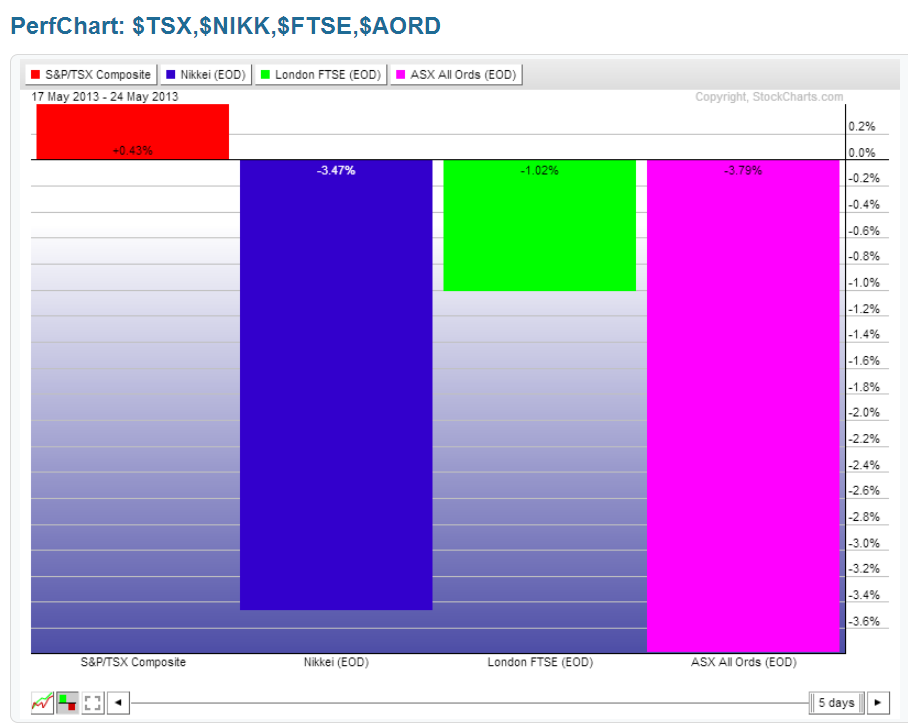
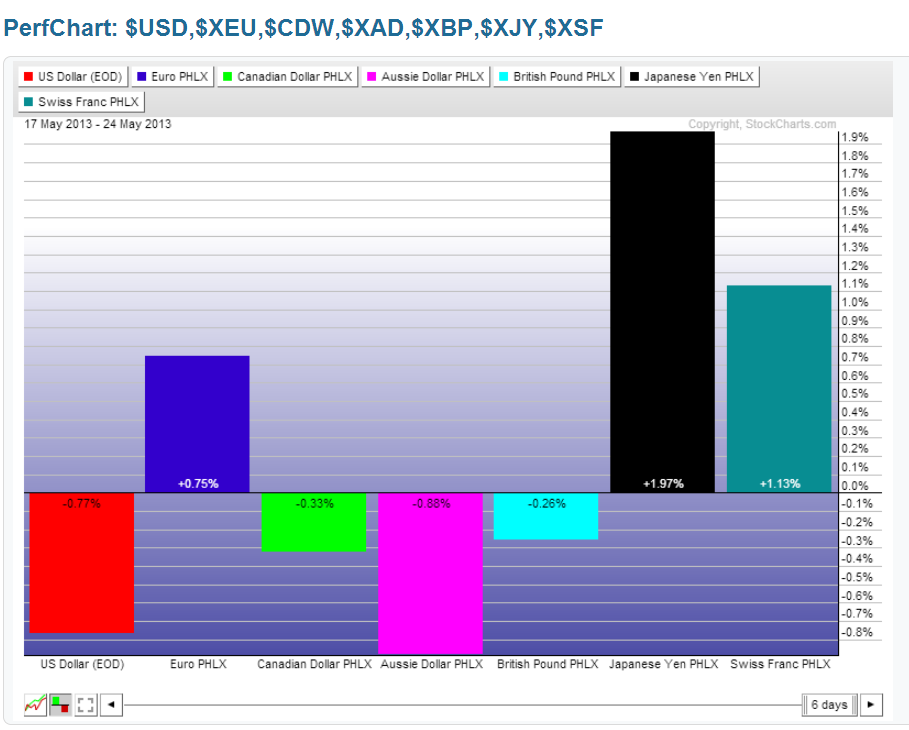
Various World Markets
I’ve provided the following percentage gained/lost graphs (without commentary) for the purpose of simply seeing, at a glance, where money flow was directed this past week in various world markets, and to see the “outliers”…that is, which markets gained or lost an exceptional amount compared to the others (e.g., Greece makes the list again this week, not because it was one of the top percentage gainers as was the case for the past two weeks, but because it was one of the top losers (in fact, THE top loser) this week…one to watch going forward for any further weakness and to see whether it becomes a “red flag” for the rest of Europe).
My one (and obvious) comment is that it was mostly a “risk-off” week.


Enjoy your weekend and good luck next week! The U.S. bond and equity markets are closed on Monday, May 27th for Memorial Day…my thoughts and prayers are with those who’ve lost loved ones.
