
I posted a possible double-bottom on SPX on twitter intraday on Friday, and that double or W bottom is mirrored on ES. Since then the ES version has broken up and unless we see a sharp retracement into the open, we’ll see a break up on the SPX version at the open as well. Here’s the setup targeting 1675 on ES and it’s worth noting that 50 hour MA support is now in the 1651 area:
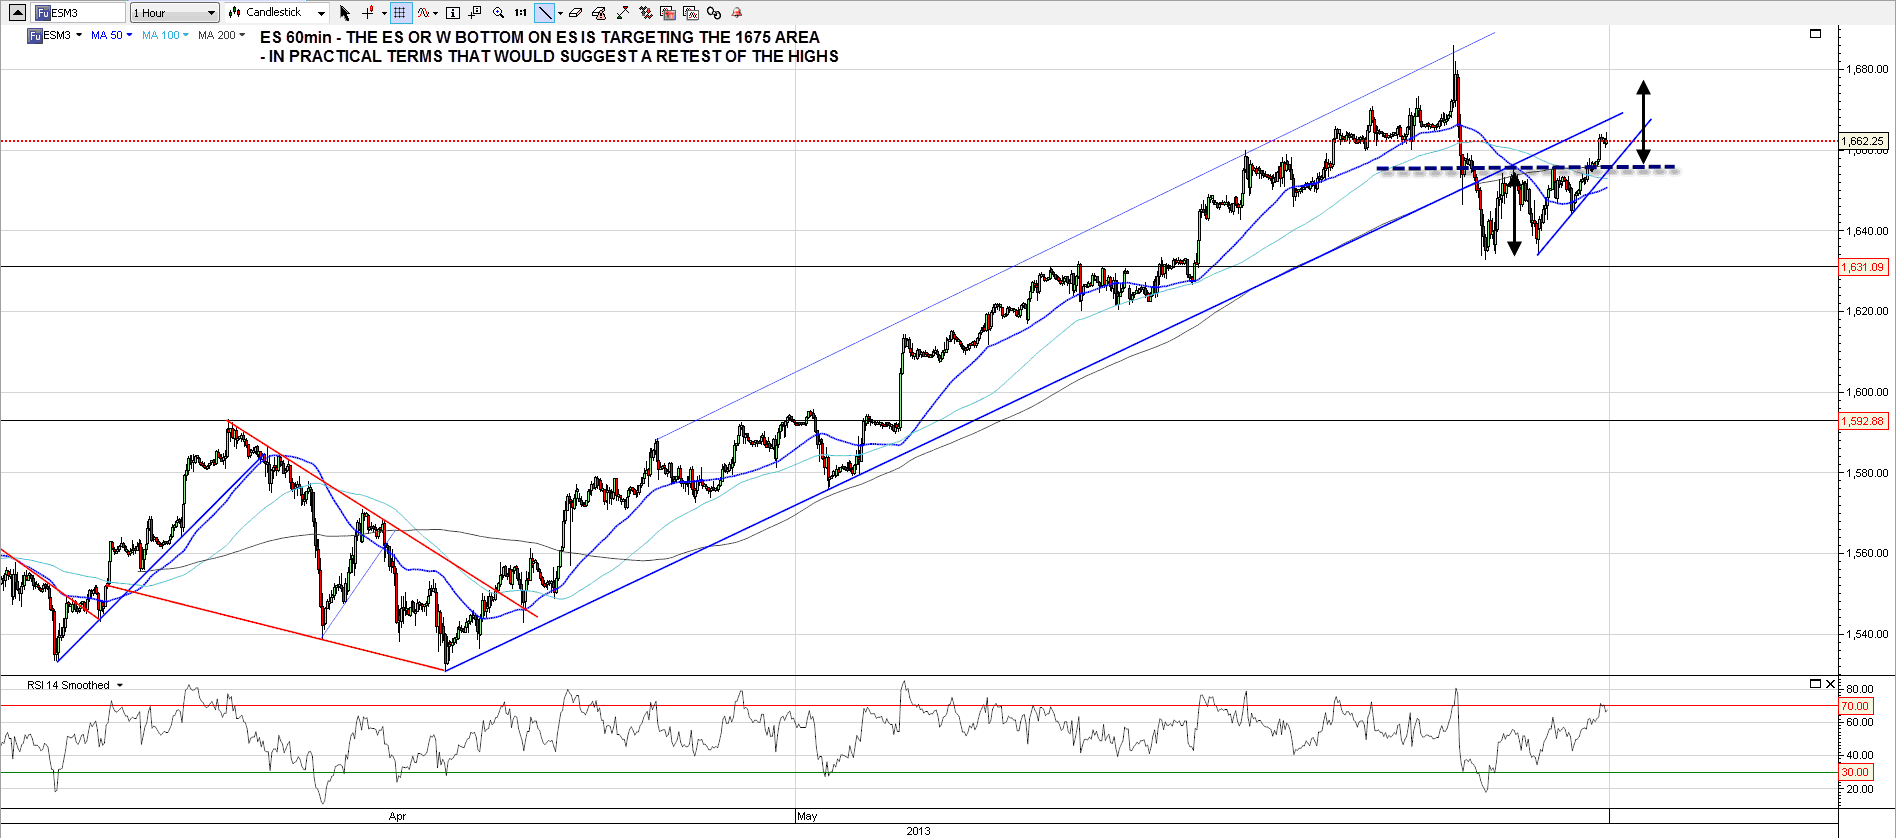
Here’s the SPX version that I posted on Friday. The target for that is also 1675, but in practical terms, as with the ES version, it suggests a test of the current highs:
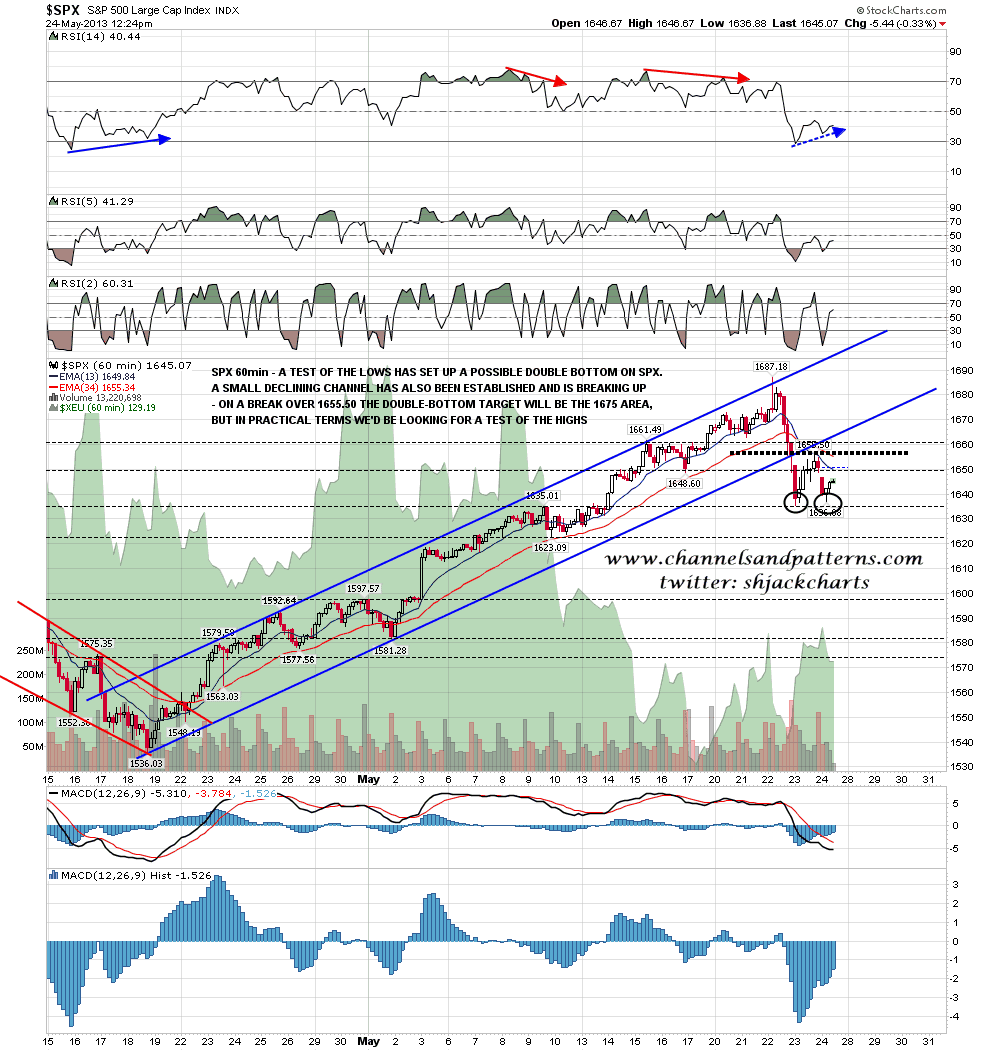
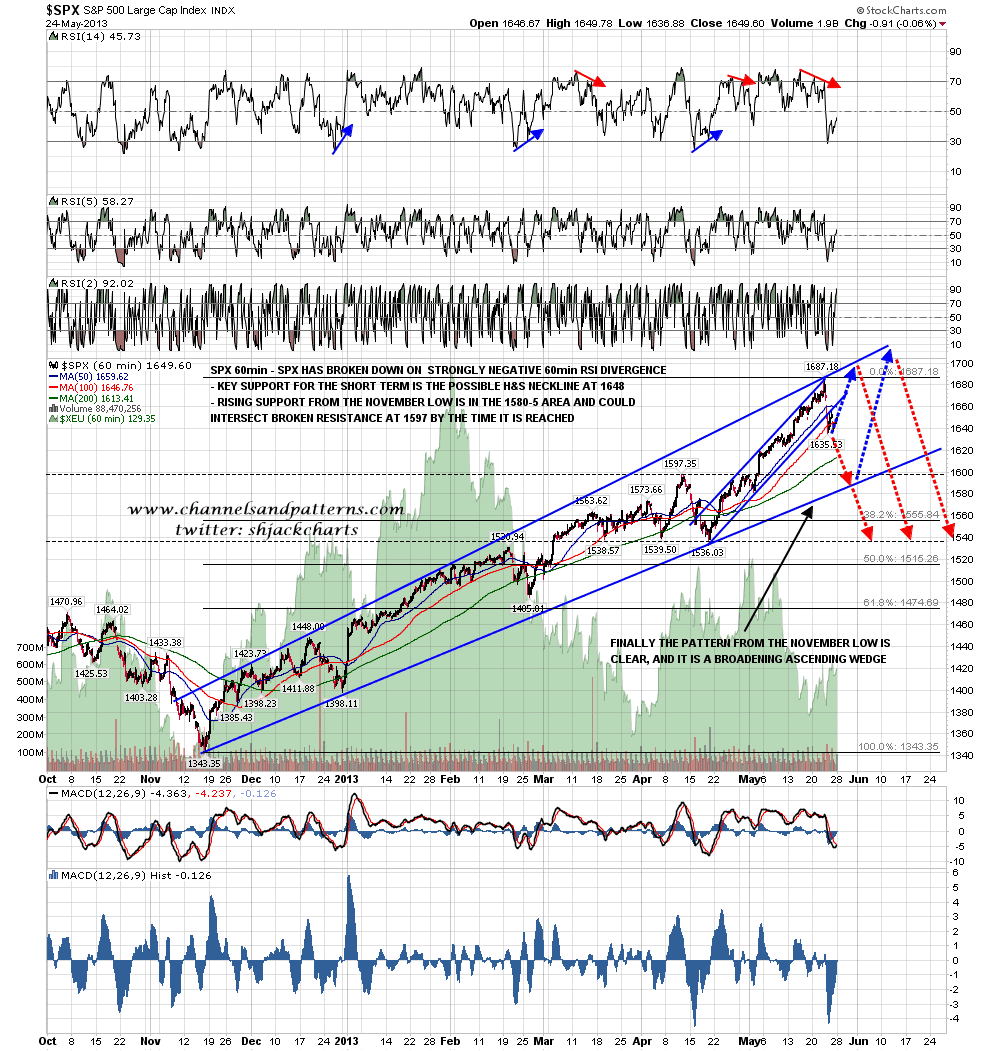
Now the SPX 60min chart I posted on Friday showed various options for retesting the highs, and the main reasons for thinking that’s likely are that:
– We usually see a sharp spike down before an interim top is made
– A higher high within the broadening ascending wedge would set up the daily negative RSI divergence that we would usually see here
– An interim top would usually be made with an H&S or double-top forming with the initial spike down as part of that topping pattern.
Due to the space constraints within the very clear broadening ascending wedge on the 60min chart I’m favoring the double-top option here, but if the next move up from here is slow, it might be that we could see the head on an H&S form next. We shall see how it looks at the retest of the highs. Here’s the updated broadening ascending wedge on the SPX 60min chart:
On the SPX daily chart support at the middle bollinger band has been holding and that was decent area to see the lows last week:

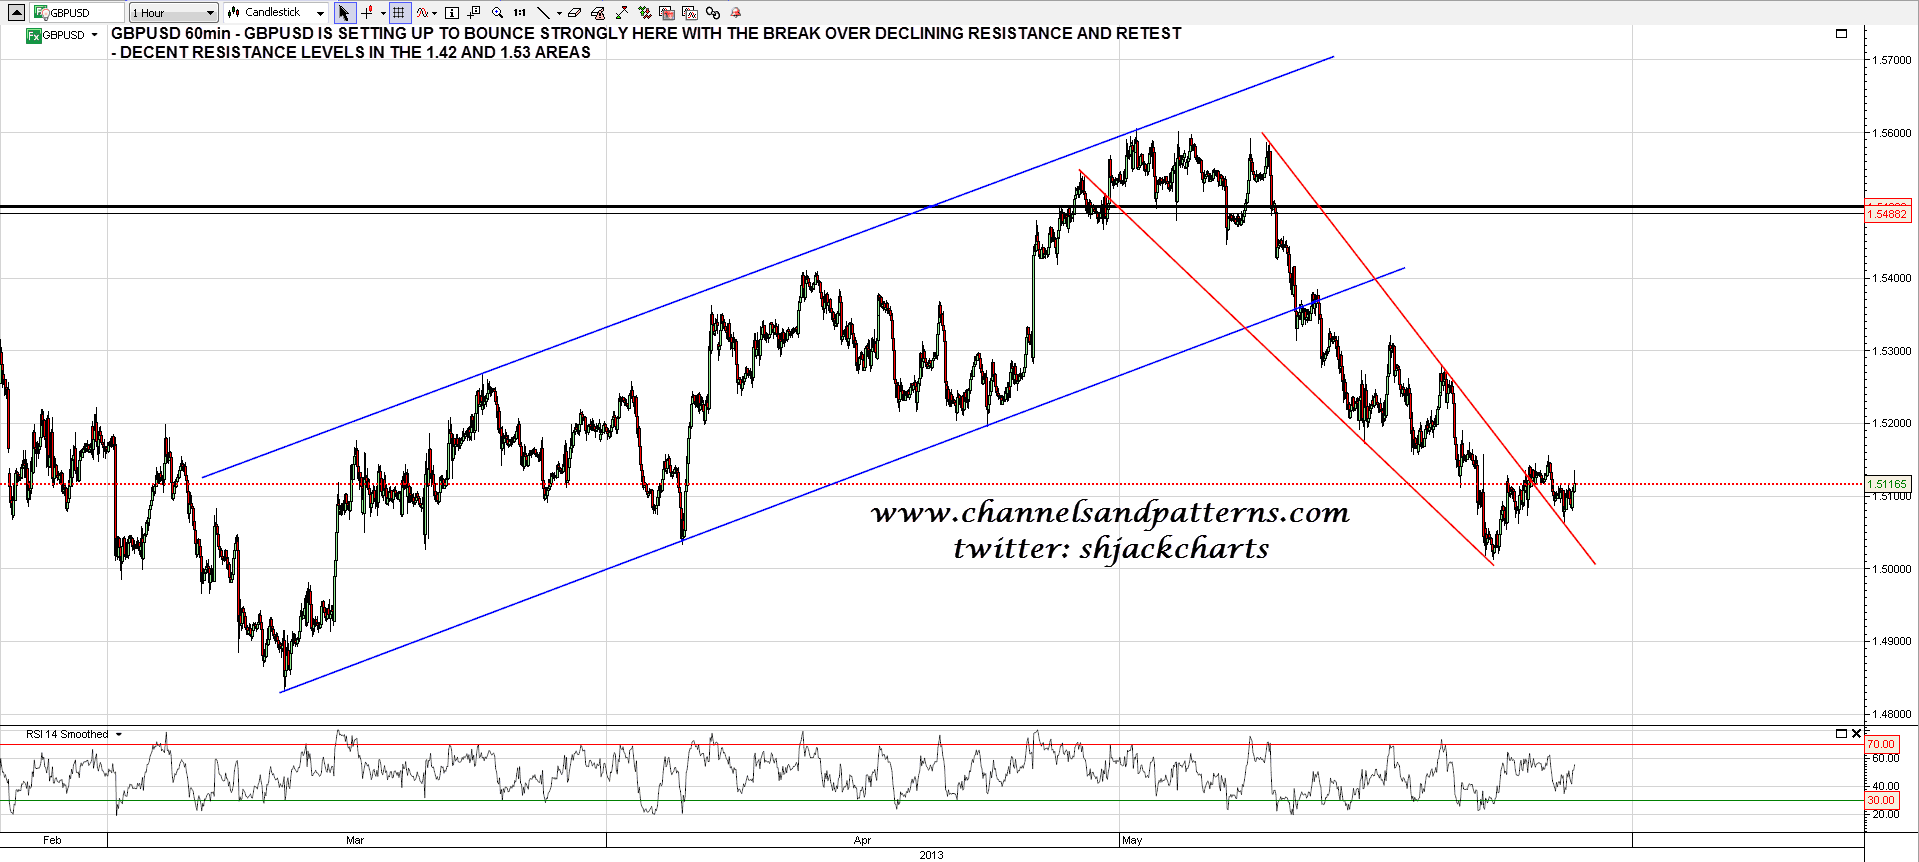
I won’t post the CL chart today as I’m leaving some space to look at Shanghai, but that is bouncing with equities so far and may well run further. what I will look at today is GBPUSD, which I have been using as a proxy for the anti-USD trade generally, and GBPUSD broke up from declining resistance late last week and has now retested the break. More than likely we will now see a strong bounce and I’m looking at resistance in the 1.53 area as an important target:
Back on 29th November last year I uploaded a chart showing the SSEC (Shanghai) Daily to Screencast. I think I did this for a weekend article where it got cut from the final version (!!!!!). Otherwise I think I just posted it on twitter where it had an unremarkable 48 views. That was a shame as I nailed the low on Shanghai perfectly then and from 2027 when I posted the chart it made the 2280 target I gave then, and then then went beyond almost to the 2450 area resistance area I had marked on that chart. Here is that SSEC Daily chart that I posted on 26th November:

What’s my point? Well firstly that I was struggling to interest anyone in my SSEC chart then, Shanghai having been written off by most as a lost cause after a very extended decline, and that’s sometimes when charts can become most interesting. Secondly though the February high on SSEC was near established resistance that was also a candidate IHS neckline, and the right shoulder from there has now reached the right area for an ideal right shoulder low. If SSEC breaks up through the IHS neckline I have the IHS target in the 2925 area, some 27% above Friday’s close. As with the measured move at the start of the year, SSEC may well not stop there of course:
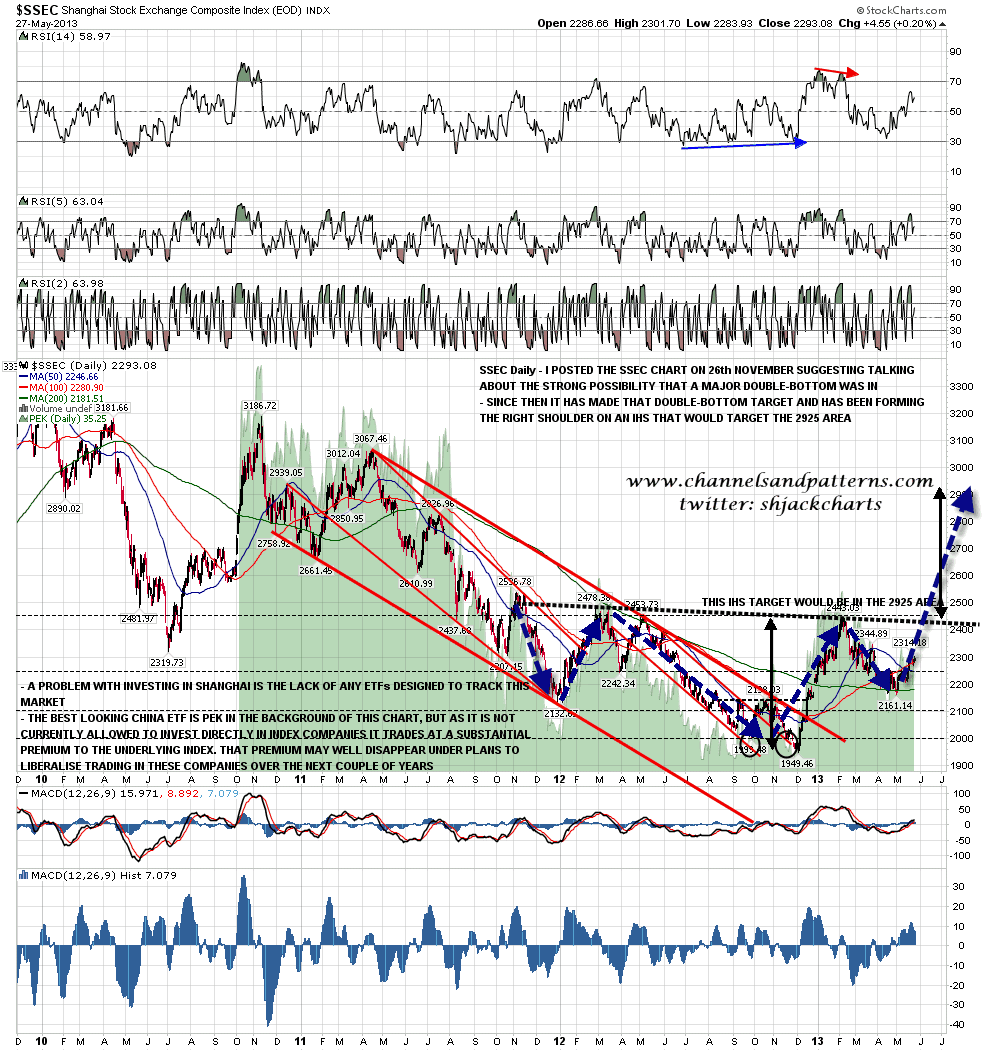
SSEC is a tricky one though, as foreigners cannot invest directly in the market. There is a decent futures proxy which is CN for the FTSE Xinhua 50 index, and I’ve found a reasonable ETF proxy in PEK, though that ETF has significant issues that I mention on the latter chart. I’m calling for suggestions on better ways to play Shanghai here as I think it looks like a very decent play here, with most of the gains from last November’s major low still to come. Suggestions invited.
As for ES I’m obviously leaning bullish looking for a test of the highs, though that test might not necessarily make a new high. Important support at the 560 hour MA in the 1651 area.
