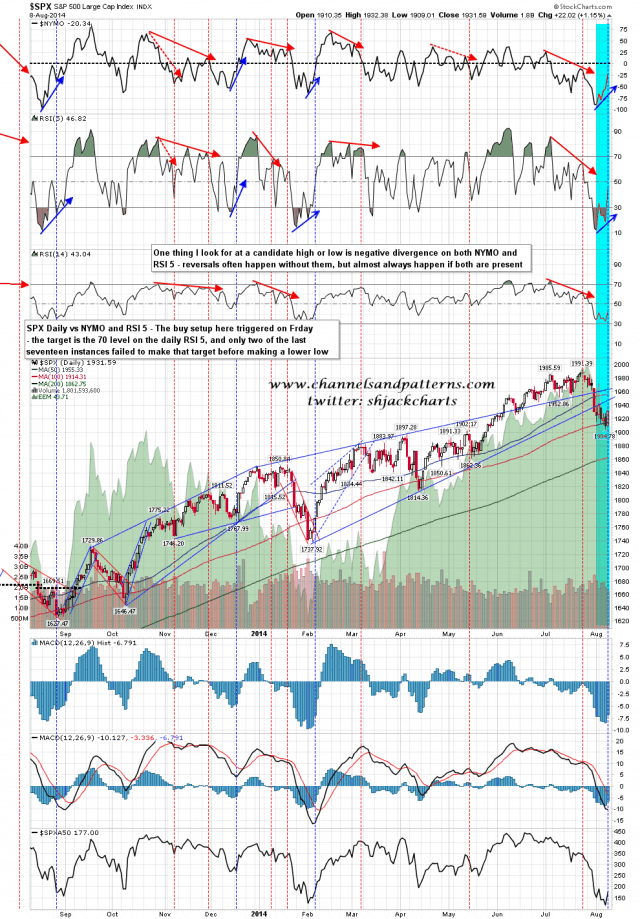
The long setup I was looking at on Friday morning triggered on Friday so the daily lower band ride should be over and I’m looking at upside targets. The main target I’m watching is not an SPX level but the 70 level on the daily RSI 5. The RSI 5 closed on Friday at 47, and I’d expect to see a rally of at absolute minimum to the 50 DMA to make this target. Of the last seventeen of these from the start of 2007, only three retested the lows before making my RSI 5 target at 70, and two failed in the 60 area before going on to new lows. This is a strong buy signal. SPX daily vs RSI 5 & NYMO:
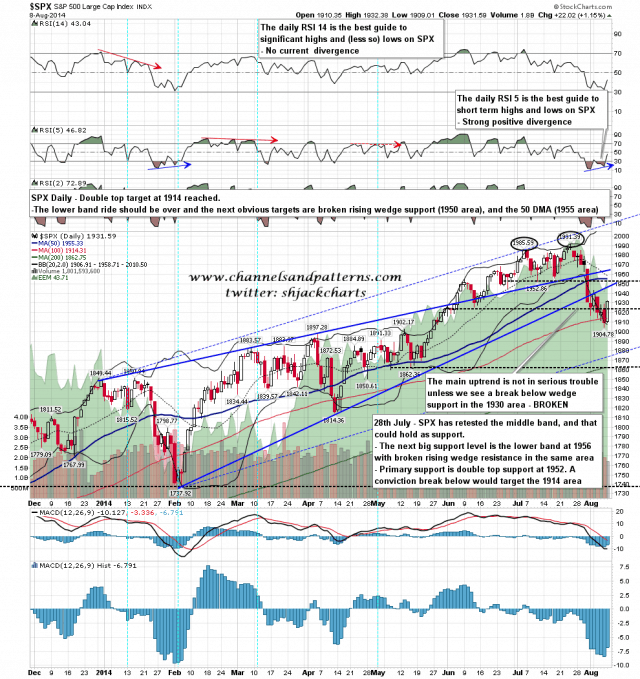
On my standard daily chart I have the obvious first resistance levels at broken wedge support in the 1950 area, and then the 50 DMA and 1955 with the daily middle band at 1958. My feeling is that we will at minimum test that 1955-8 target, and will most likely retest the highs after that. Only nine of the last seventeen signals went directly to new highs, but that is nine of the last twelve signals since the 2009 low once I strip out the previous five, and one of those three tested the previous high and failed there making the second high of a double top. SPX daily chart:
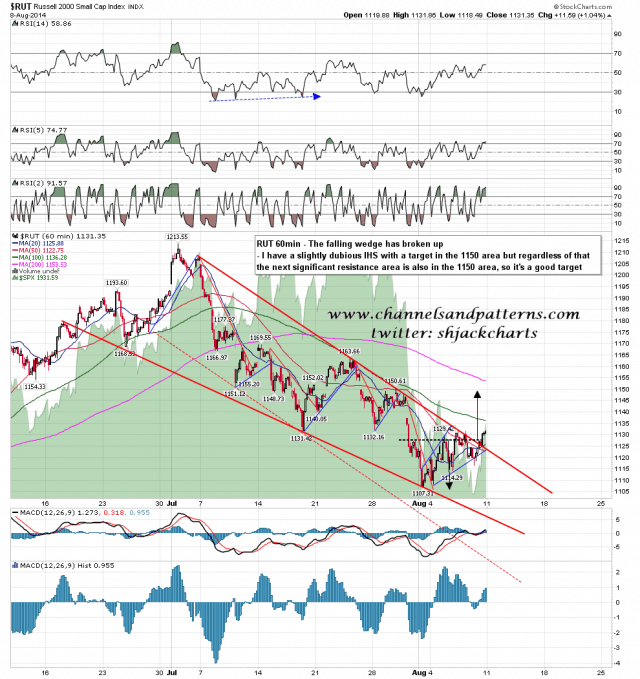
The falling wedge on RUT broke up and I have a slightly dubious looking IHS with a target in the 1150 area. As it happens the next serious support/resistance level above is also at the 1150 level so it is the obvious next target in any case. RUT 60min chart:
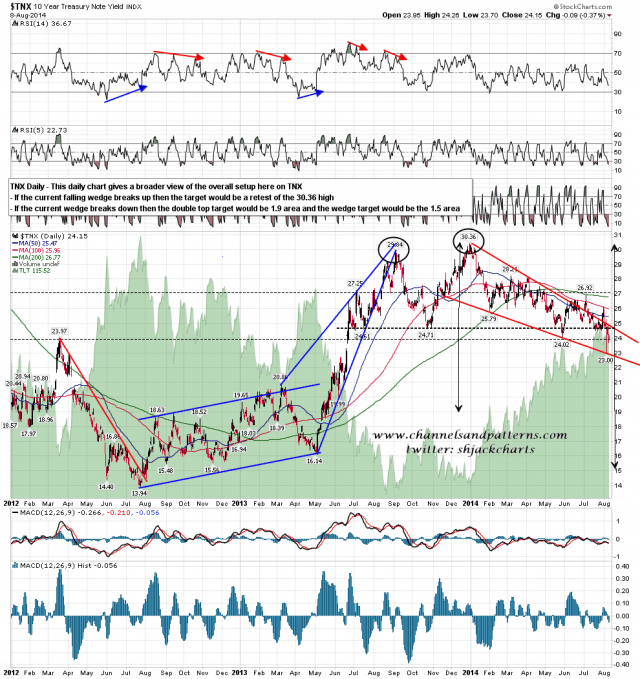
I posted this TNX chart late last week showing the test of falling wedge support. if this breaks down we could well see a major further bond rally that would erase most or all of the losses on bonds from the 2012 highs. That could obviously have implications in the equity and currency markets. Watching with great interest. TNX daily chart:
I have decent support today at the 50 hour MA at 1926 and am doubtful about SPX breaking lower than that. ES is looking very overbought short term and I’m thinking that we may well see the opening gap fill. If we are going to new lows soon then the current setup strongly favors a move to at least test the 50 DMA (1955) and the daily middle band (1958) before turning back down. Three of the last seventeen of these setups retested the lows before making target so that’s possible here, but not statistically that likely.


