
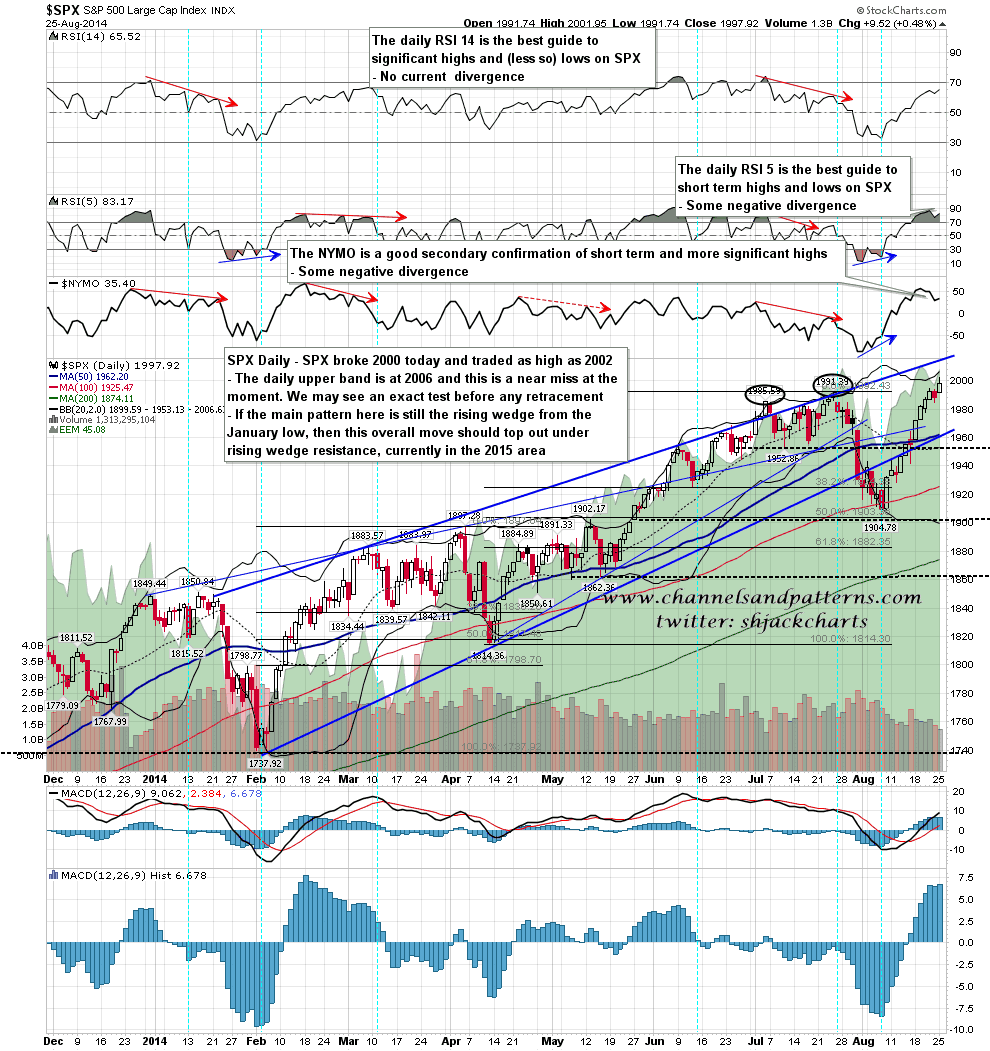
Last Thursday I was outlining the two main options for the current move as I see them. The first option is failure at 2010-20 resistance to make the second high of a double top targeting the 1800 area. The second option is that SPX breaks over that resistance and heads to currently theoretical channel resistance (from 1343 low), somewhere in the 2060-90 area. I said then that I favored the first option, but obviously we might see a break up into the second.
So where are we now? Well we haven’t reached my resistance area yet, but we have a clear 70% bearish rising wedge established from the 1904 low, and increasing negative divergence on the 60min RSI 14, the daily RSI 5 and, always nice to see, the daily NYMO. We have a promising looking top setting up for that 2010-20 test, and the odds of a failure there are improving. SPX daily chart:
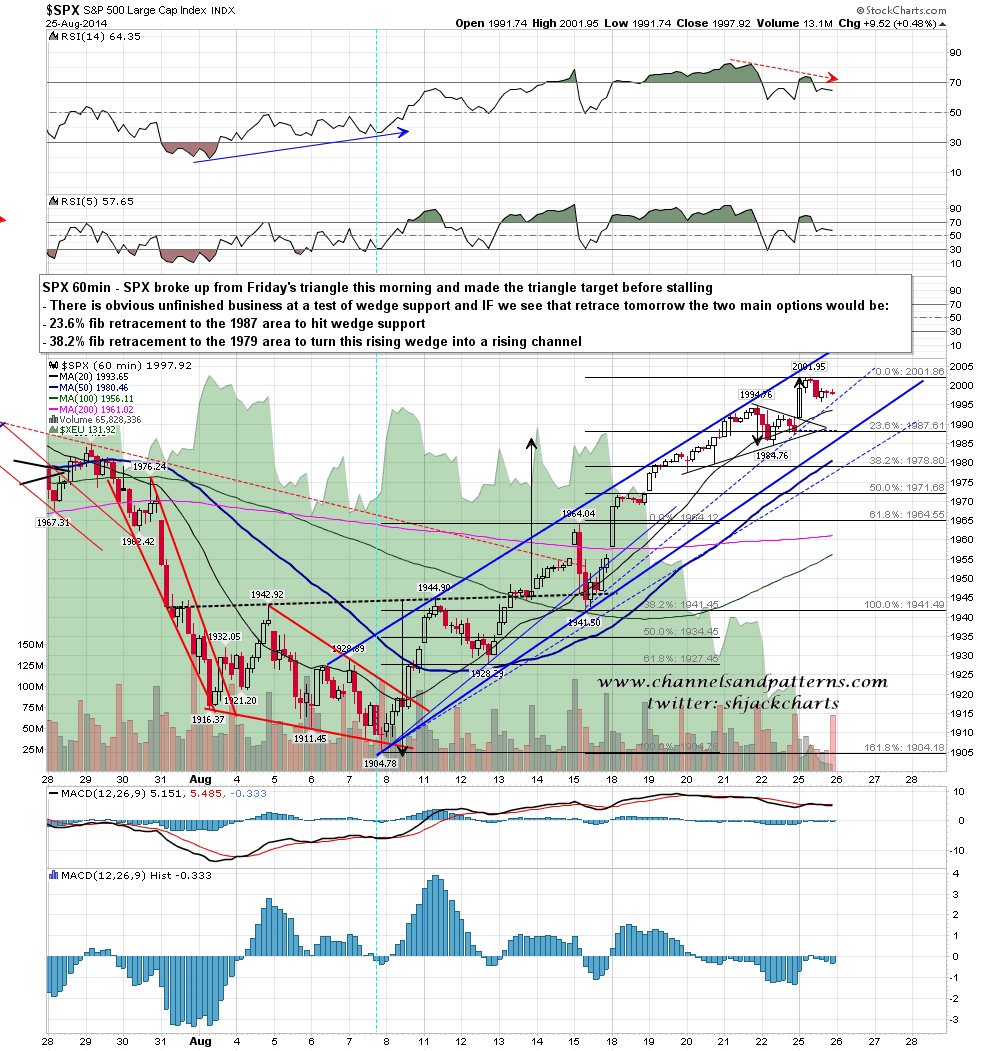
What this setup could really use here very soon though would be a test of rising wedge support on SPX, and yesterday’s daily candle was promisingly bearish. I posted the chart showing the two main options if we were to see that retracement today on twitter last night and they are either, a 23.6% fib retracement to rising wedge support in the 1987.5 area or, a 38.2% fib retracement to the 1979 area.to turn the rising wedge into a rising channel. The smaller retracement would be the more bearish on the next move up. After that retracement I’d be looking for a further move up to test strong resistance in the 2010-20 area, and then most likely failure there. SPX 60min chart:
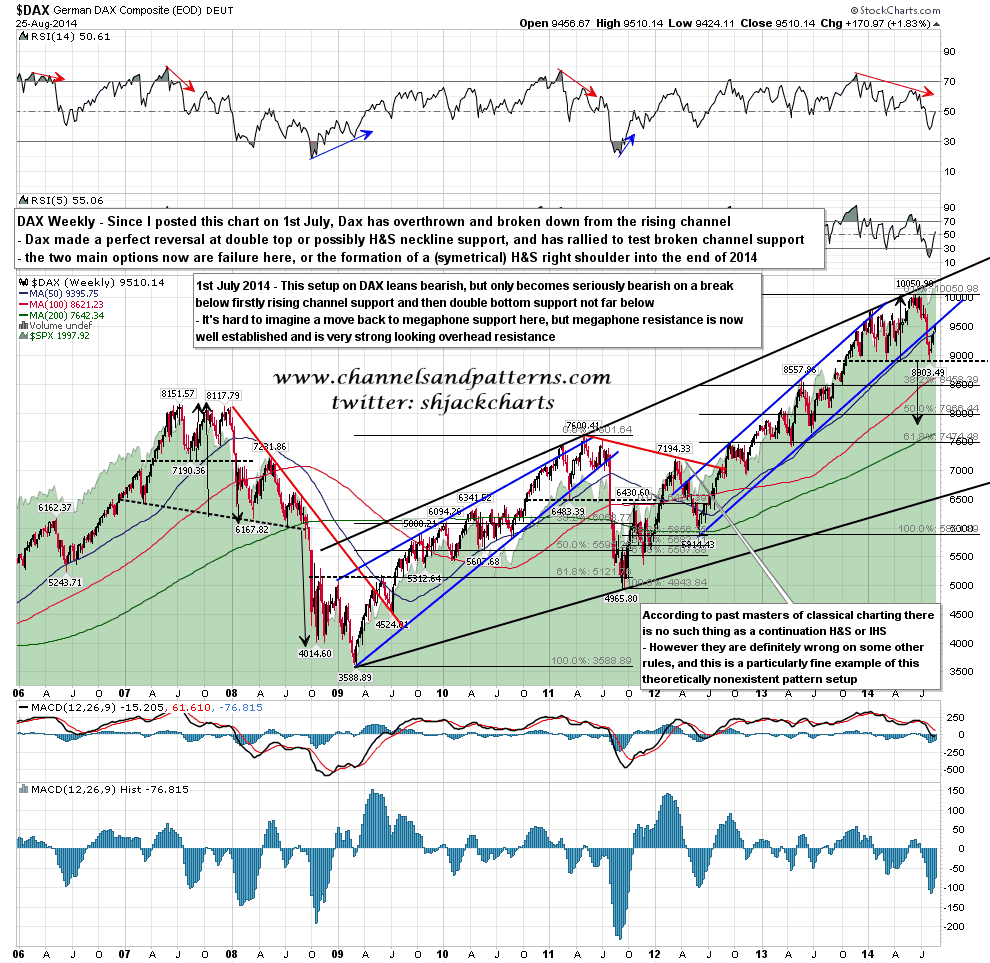
So what looks toppy to me here? Well there’s the overall setup on SPX and other US indices of course, but the DAX weekly chart probably puts it best. I posted this chart on 1st July with comments which I have left on there, and since then DAX has broken the rising channel and tested double top (or possibly H&S) support. The rally has it retesting broken channel support at the moment. I’m not looking for a move to test overall rising megaphone support from 2009, though I’m not ruling that out, but the next big leg up on SPX will most likely be a more modest leg up to retest megaphone resistance on DAX, and it’s going to need some room for that. A 20%+ move from the high to the double top target would set that up nicely and, whichever way you look at it, that move is most likely coming soon. DAX weekly chart from 2006:
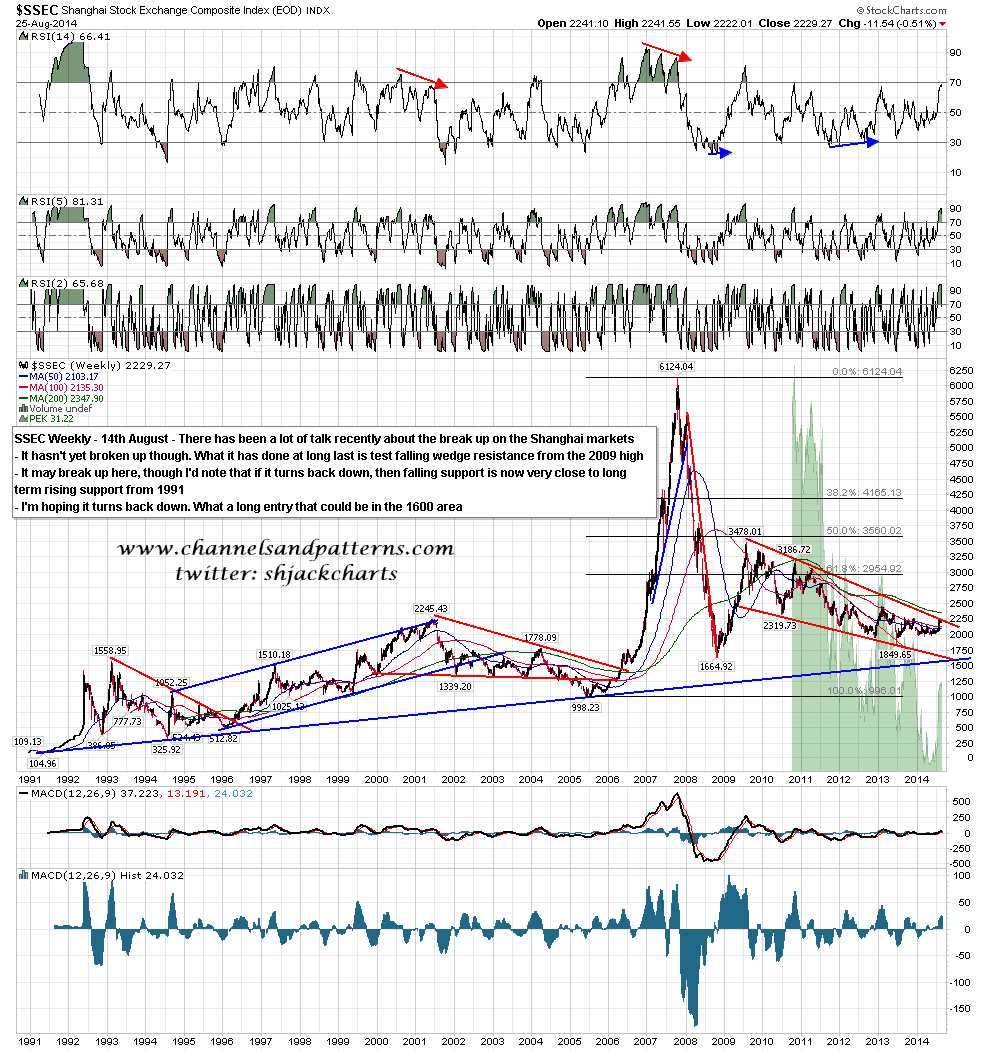
Why now though? Well for that I’m looking at Shanghai. Everyone’s been talking about the break up on SSEC but actually all it has managed is to rally to test falling wedge resistance. It hasn’t broken up yet, and the long term setup favors one more move to falling wedge and long term support in the 1600 area. It could go the other way but I strongly suspect not, not least because the daily chart is showing likely reversal here, and that topping process is happening now. That clock is ticking. SSEC weekly chart:
We may not see it (again) but I’m favoring that retracement today and most likely the higher target in the 1987 area, but possibly as far as the lower target in the 1979 area. I would be very surprised to see a significant high made at the current level so if we see that retracement, that should be a dip to buy.
