
I am looking very hard for a significant low in the next day or three, and for those wondering why that is while reading this post I refer you to the last chart in this post and the associated stats with the current daily NYMO/RSI 5 setup.
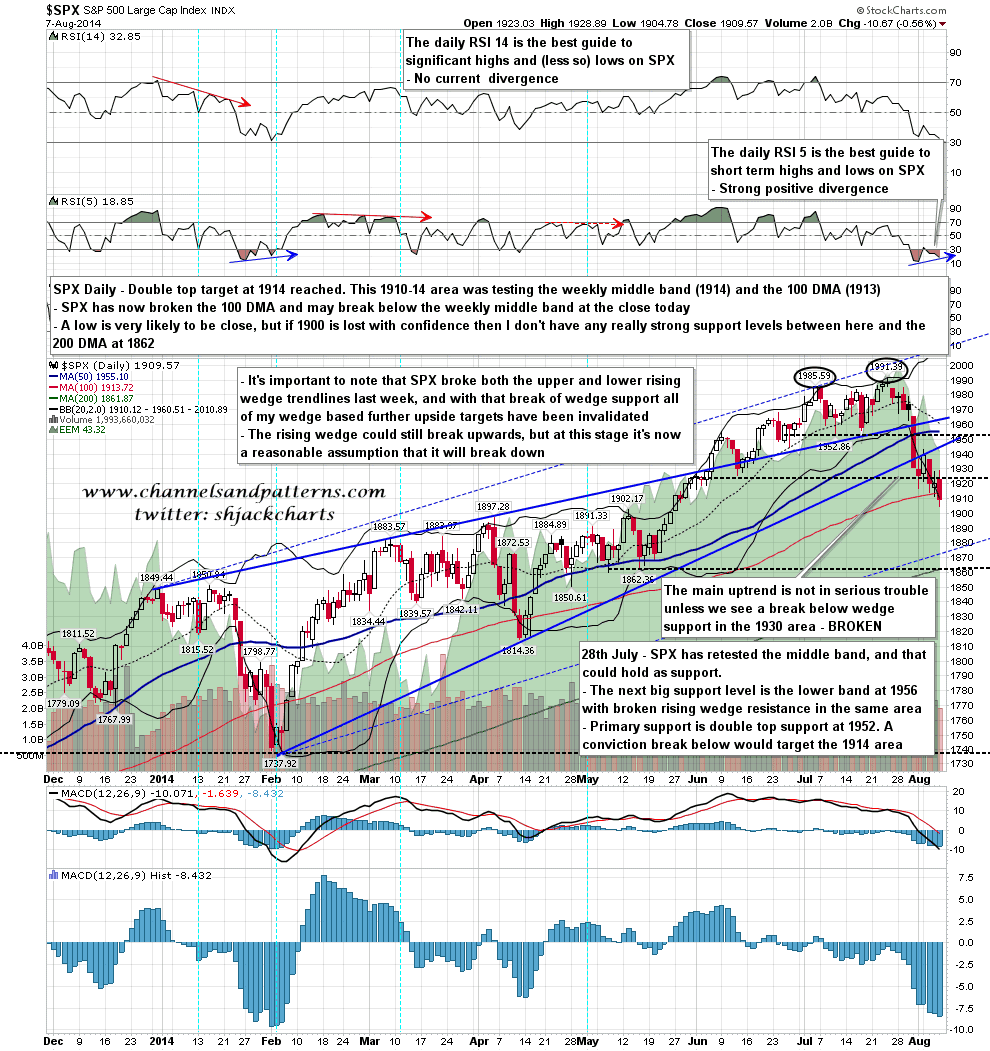
Bulls had a shot yesterday morning and blew it badly in short order. SPX closed on the daily lower band for a second day, and that was the sixth day of the current ride down the daily lower band. If the downtrend continues then I’d expect the lower band to close in the 1900-3 area today.
What was significant yesterday is that support in my 1911-4 range broke, and SPX closed four handles below the 100 DMA. If that follows through then the next big support level is the May lows and the 200 DMA in the 1862 area, though there are a series of smaller levels between of which the strongest is at 1883/4. SPX daily chart:
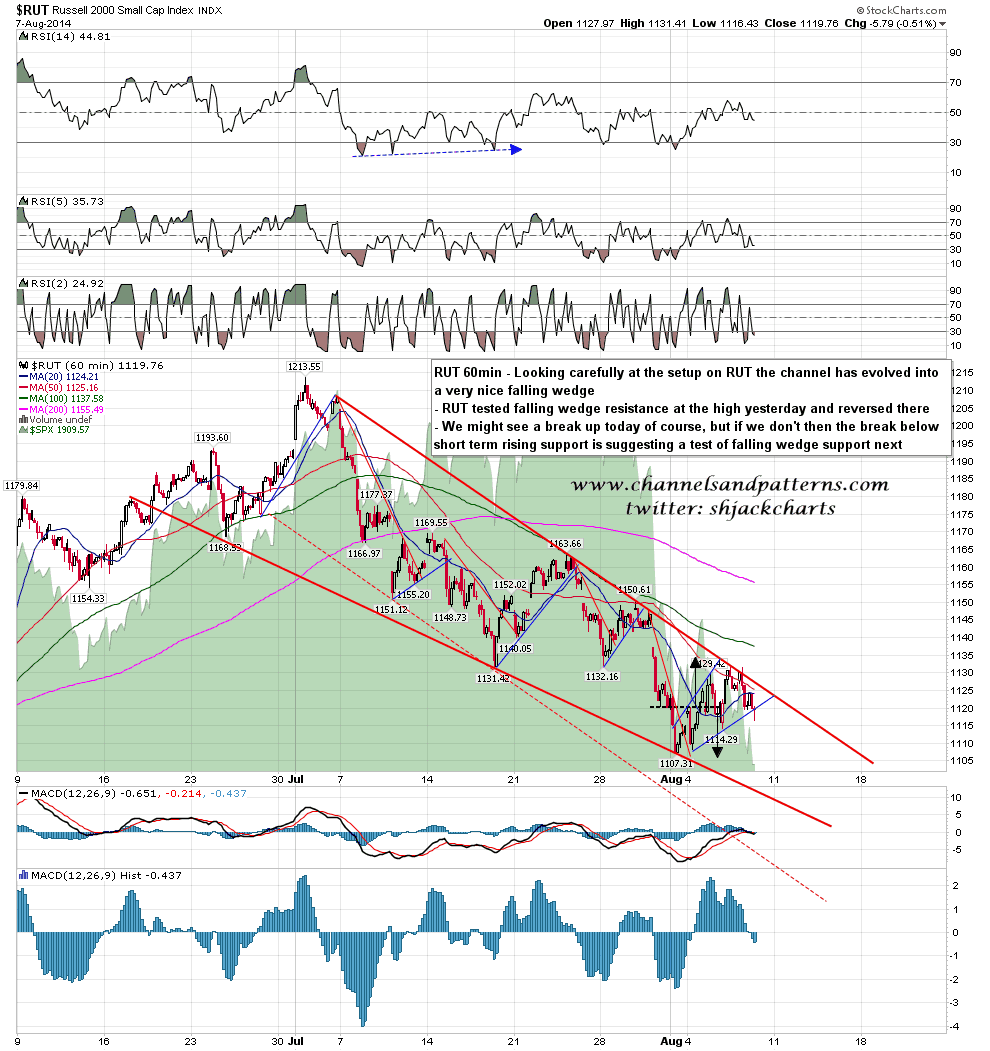
The tell for the bull fail yesterday morning was that RUT failed to confirm the SPX gap over trendline resistance. I think it’s clear that RUT has now evolved into a 68% bullish falling wedge and I have redrawn the trendlines with channel support as secondary support. After the fail at falling wedge resistance yesterday RUT then broke short term rising support which is suggesting that the next move is to test falling wedge support again. We may see another spike down after a morning high today. RUT 60min chart:
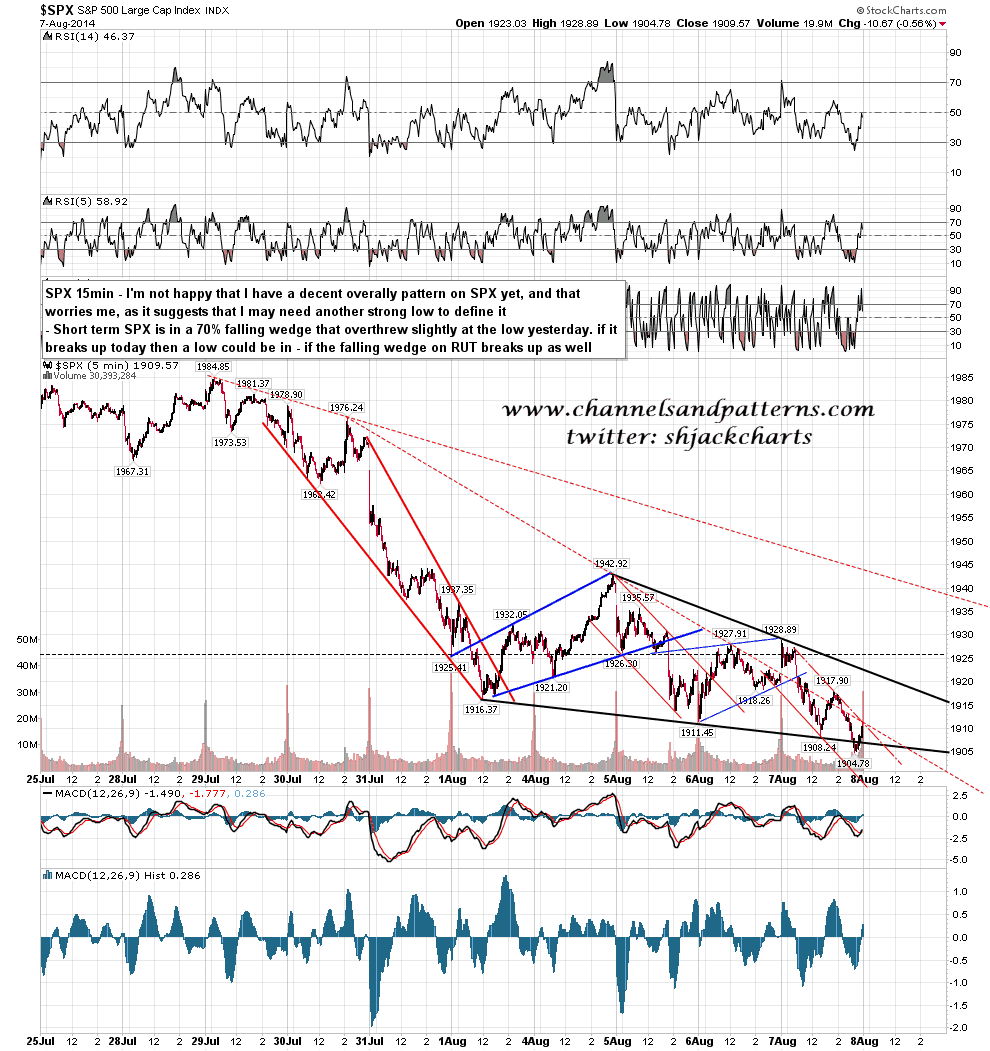
I’ve been poring over the SPX chart and have three minor patterns for the decline from 1884. I don’t have a decent overall pattern for this decline as yet, and that’s a concern, as we may need another spike down to define that pattern. I’ll be posting the minor patterns updates on twitter as I look for a low here. SPX 5min chart:
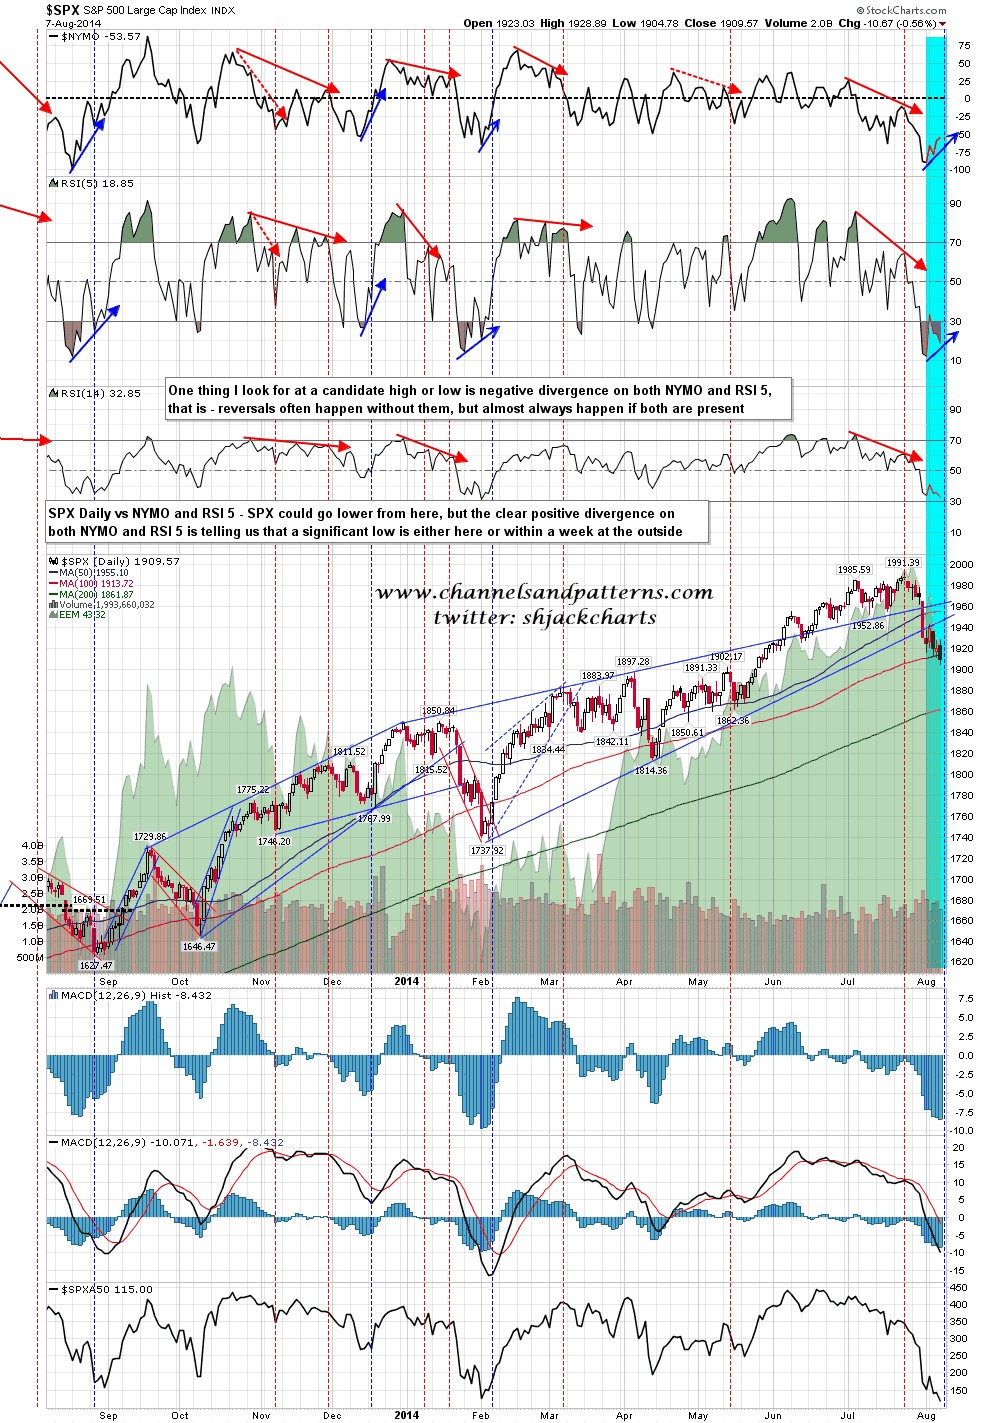
So why am I looking hard for a low here? Well if you have a look at the daily chart below you can see that there is obvious and strong divergence on both NYMO and the RSI 5. The stats on this setup are quite remarkable, and I ran these back to the start of 2007 overnight.
Since the start of 2007 there have been seventeen comparable daily divergences on both NYMO and RSI 5. in every instance a significant low was made, usually within a day or two, but less than five days later at the outside. Of those seventeen lows, nine went to new highs, and eight rallied to lower highs. Of the eight that rallied to lower highs only three were since March 2009, and of those three, two made it back to the 50 DMA, and the other fell just short. This is a very strong setup for reversal. SPX daily vs NYMO and RSI 5:
I have falling channel resistance on SPX in the 1923 area this morning and will be watching that area with great interest. If we see a break up I’ll be looking for confirmation from RUT. I’ll be assuming failure at a morning high unless demonstrated otherwise. I like the gap fill today, noting that the daily lower band will be below it, and that if the lower band ride is ongoing, I would expect at least a touch of the daily lower band today.
