
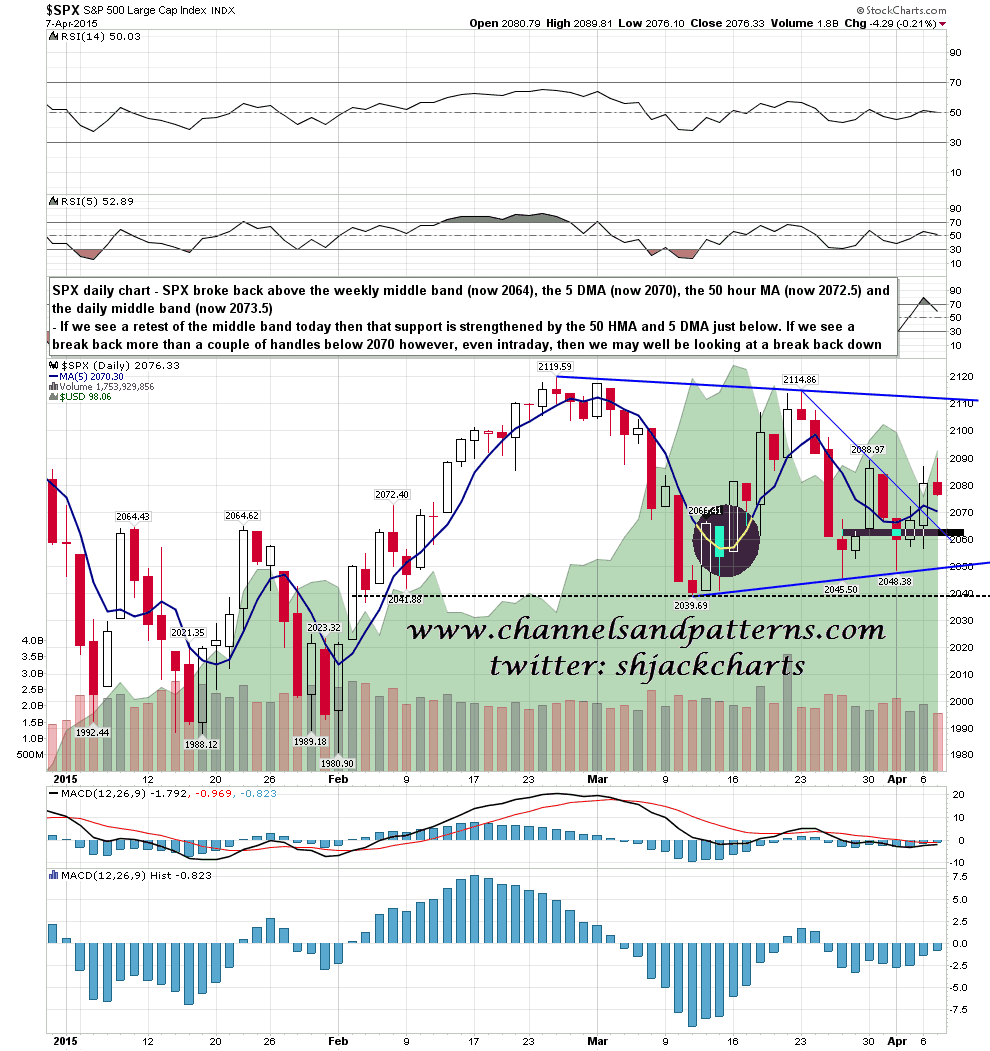
I was talking yesterday morning about the likelihood that SPX would retest broken resistance as support and it took a while, but that was tested at the close yesterday. We could see SPX go a bit lower this morning but what we saw yesterday may well be all. My bull/bear line is at 2068/9 this morning, with the SPX daily middle band now at 2073.5, the 50 hour MA now at 2072.5, and the 5 DMA at 2070. SPX 5DMA chart:
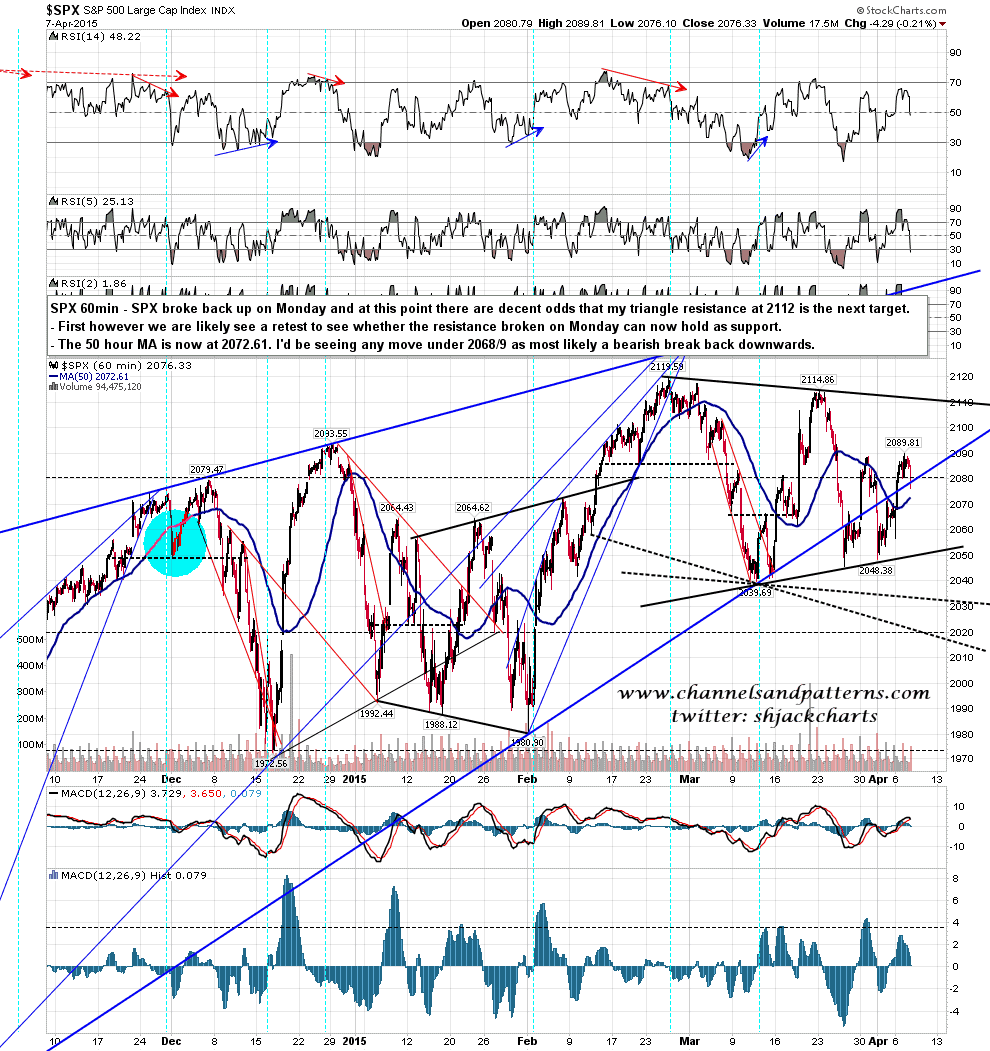
As long as support holds today I’m looking for a test of triangle resistance in the 2112 area. If SPX trades under 2068 then most likely it is breaking back down again, and I’d be looking for possible support at triangle support in the 2050 area, and if that was broken I’d be looking for a break below 2039.69 shortly afterwards. SPX 60min chart:
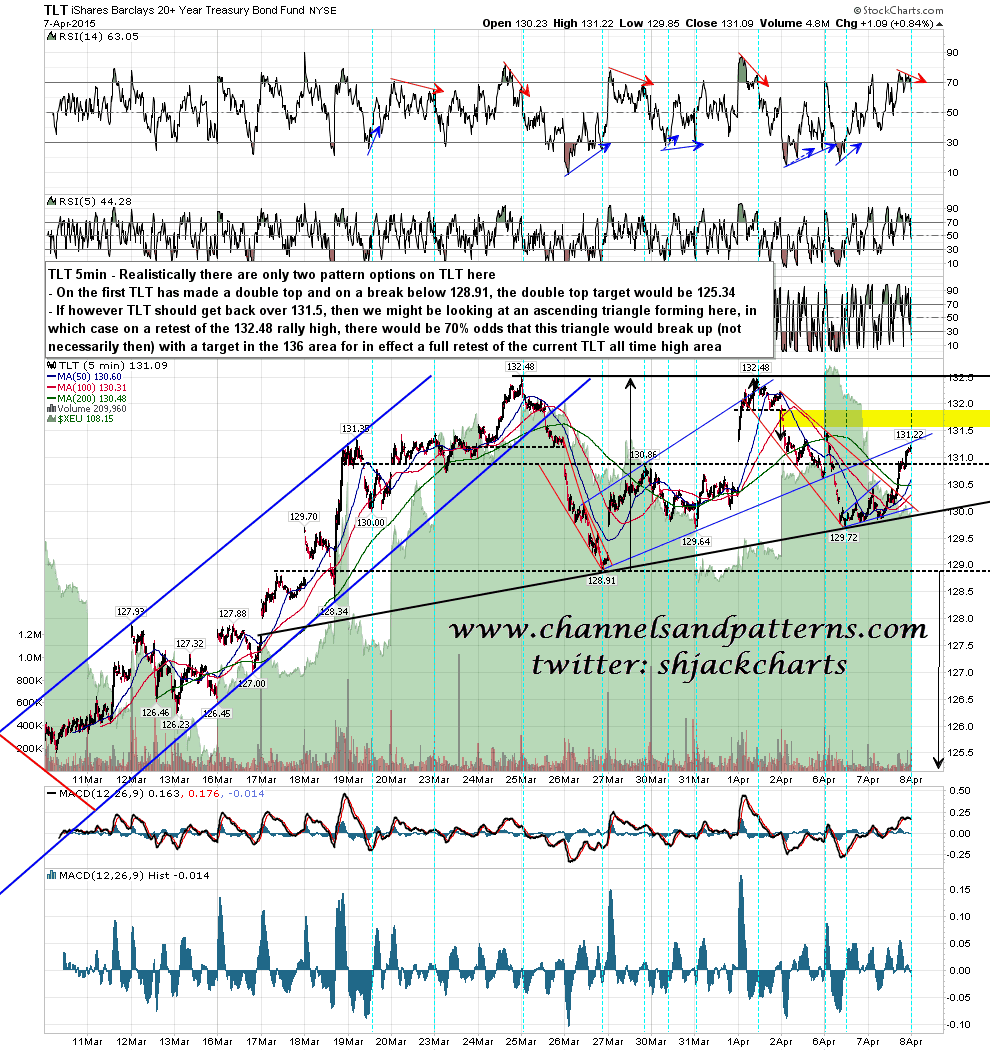
TLT is at an inflection point here with two pattern options. My preferred option is a double top targeting 125.34 on a break under 128.91. If TLT can break back below possible triangle support in the 130 area I’d be assuming that short was solid.
The other option becomes much more likely if TLT can recover over 131.5. That option is an ascending triangle which would confirm on another test of 132.48. We might not see a break up then, but these do break up 70% of the time and the target on a break up would be in the 136 area, getting close to a retest of the TLT all time high at 137.66. This option should be making the second high of a much larger double top and while this is not my preferred option, it’s worth bearing in mind until we see TLT break below 130 with some conviction. TLT 5min chart:
I’m assuming support will hold here on SPX until demonstrated otherwise.
My vacation internet access is terrible so the next post may be on Friday morning. I will try to get a post out tomorrow morning.
