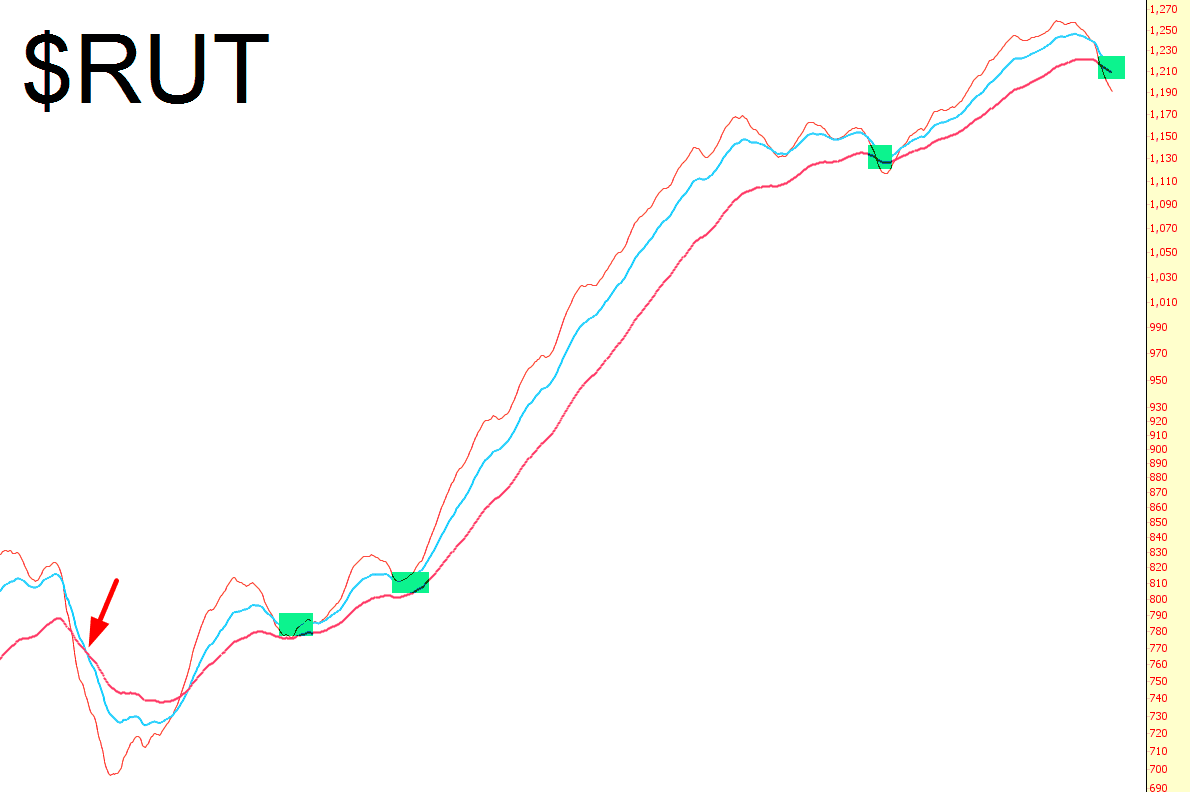
I don’t really use indicators in my trading, but I wanted to take a look at the 50/100/200 day exponential moving average on the Russell 2000. Here’s what I see, and I’ve removed the price data for simplicity and clarity:

Slope initially began as a blog, so this is where most of the website’s content resides. Here we have tens of thousands of posts dating back over a decade. These are listed in reverse chronological order. Click on any category icon below to see posts tagged with that particular subject, or click on a word in the category cloud on the right side of the screen for more specific choices.
I don’t really use indicators in my trading, but I wanted to take a look at the 50/100/200 day exponential moving average on the Russell 2000. Here’s what I see, and I’ve removed the price data for simplicity and clarity:
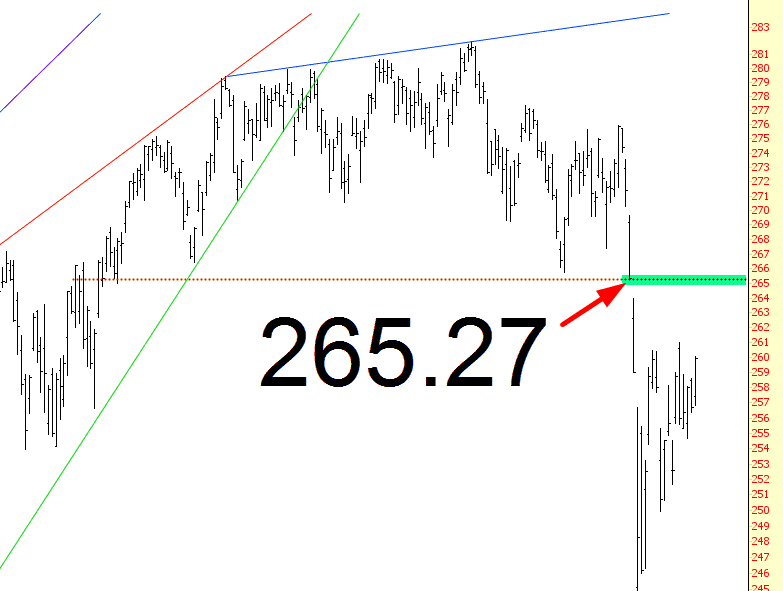
I need to scoot right now, so I’ll do a longer post later, but I wanted to say I am watching the gap below on the MDY with great interest. The “big day” Thursday is going to answer a lot of questions (and jostle a lot of accounts), and whether the tumult “respects” this gap (or screeches right past it) will be very telling.
Well, all the hoo-ha about Shemitah and the big collapse we’d see, ummm, today, apparently was another giant load of crap. Dennis Gartman has FAR more power over the markets than the Hebrew Calendar, and his repeated calls yesterday to short equities and go long bonds have led each of them to roar up and down, respectively.
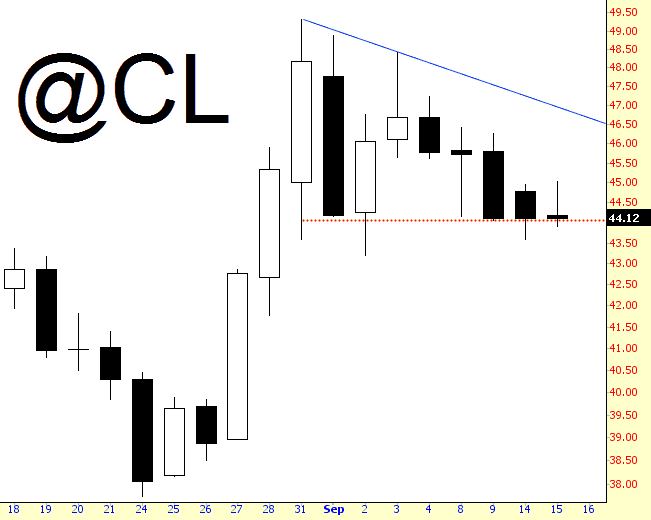
One chart I’m watching with interest is crude oil which, like most things, went zooming higher today, but it seems to have lost its mojo. Since a lot of my shorts tend to be commodity-focused, this is a chart I keep on one of my screens at all times. If this triangle can just make a clean break, we’re in the clear.
As we wake up this morning from a barrage of overnight Asian and European economic data, it is the Yen pairs which give new hope to those traders bearish on the indices.
USD/JPY

Exhibit #1 – The world’s main carry currency, the Dollar/Yen.
Just for a change of pace today I’m going to do my SPX post without any SPX charts, as I think I can get the point across better with Dow and ES charts today.
Just to clear up one issue I’m getting every morning before I start, I’ll just say that I am still expecting a retest of 1911 before a break over 1988 on the basis of my 5DMA Three Day Rule. Could this be the first failure since the start of 2007 on that stat from dozens of examples? Yes, in the sense that every instance has a possibility of failure, but I’m not seeing any strong reason to expect failure in this instance as yet.
