
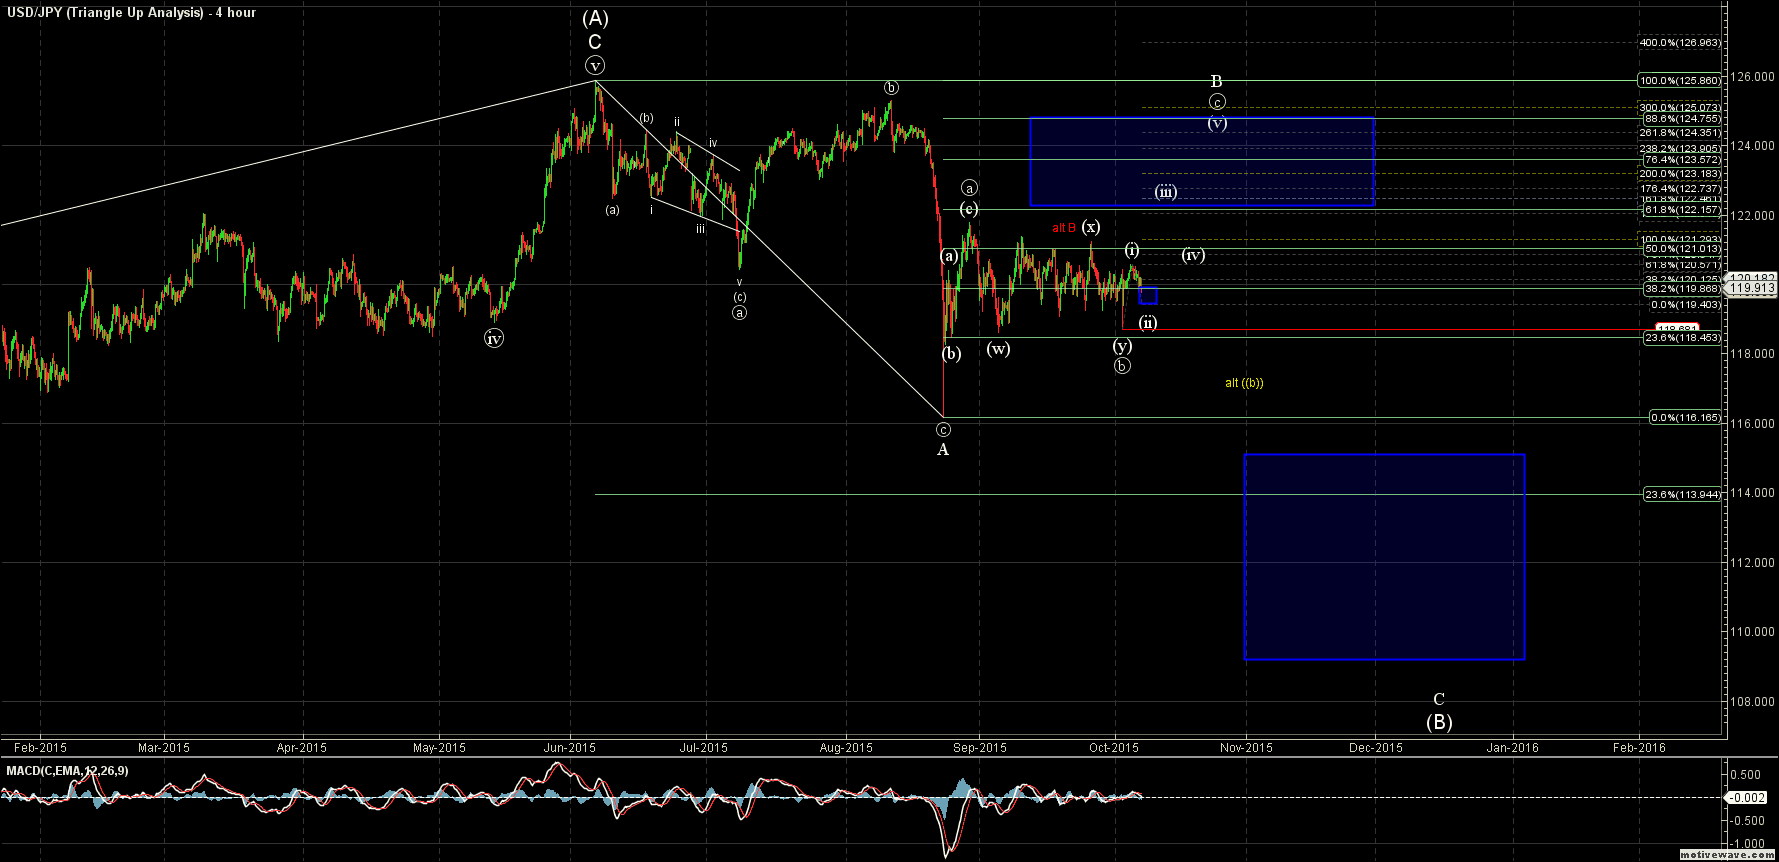
USD/JPY – This count is still extremely messy due to the flat correction that we have seen since the 8/24 low. When we have a count that unclear the best approach is to zoom out to view the bigger picture to help find some clarity.
When we zoom out on USD/JPY what we find is a clearly corrective move off of the June high that was followed by another clearly corrective move off of the August 24th low. This tells us that from the bigger picture perspective we are most likely in a large B wave. A large B wave also makes a lot of sense as B waves are often very messy and many times the most confusing of all of the waves in Elliott Wave Theory. So given that our view that we are in a large B wave off of the August 24th low the question is where within this B wave are we. Well the action since the August 24th low, and especially since the 9/4 low, is making this extremely difficult to determine however this does not mean that we cannot find a setup in which to trade.
Making the assumption that we are in a B wave as shown on all of the charts the question we have is at what level will this B wave top? Well we really only have two options either it has already topped in the form of a very ugly ill proportioned triangle or it still has higher to go into the 122-124.75 zone. I am leaning towards us still seeing higher levels to complete wave B before we start the large C wave down into the 115-109 zone.
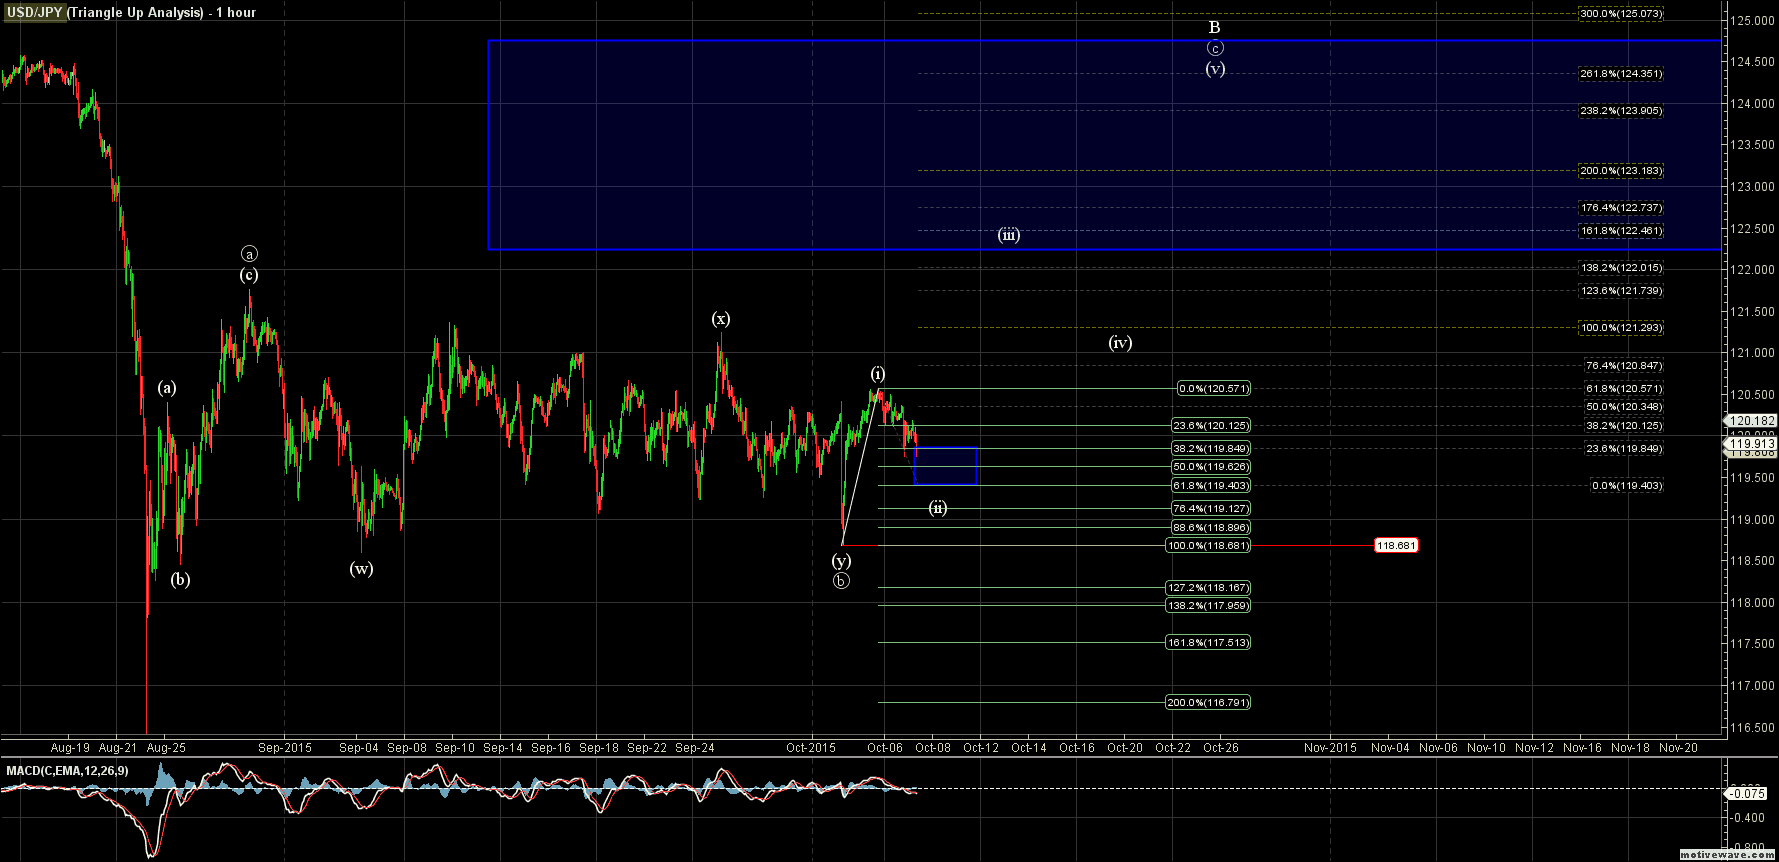
This leaves us with a short term trade setup to the long side that has us bottoming in a wave ((b)) at the 118.68 level. The move up off of that low would then count as wave (i) of ((c)) of B that projects into the 123-124.70 level. Now keep in mind that the counts are far from clear and this is a fairly aggressive trade in which stops must be adhered to.
We have already hit the upper support level for wave (ii) on this setup at the 119.84 level. The next support level for wave (ii) comes in at the 119.40 then at the 119.12 level below that. Invalidation of this trade setup comes in with a break of the 118.68 level. Targets for wave (iii) of c come in at the 122.46-123.18 level with ultimate targets for wave (v) of c of B in the 124.35 area. (click on chart for large version)
Originally published on ElliottWaveTrader.net, by Mike Golembesky.
