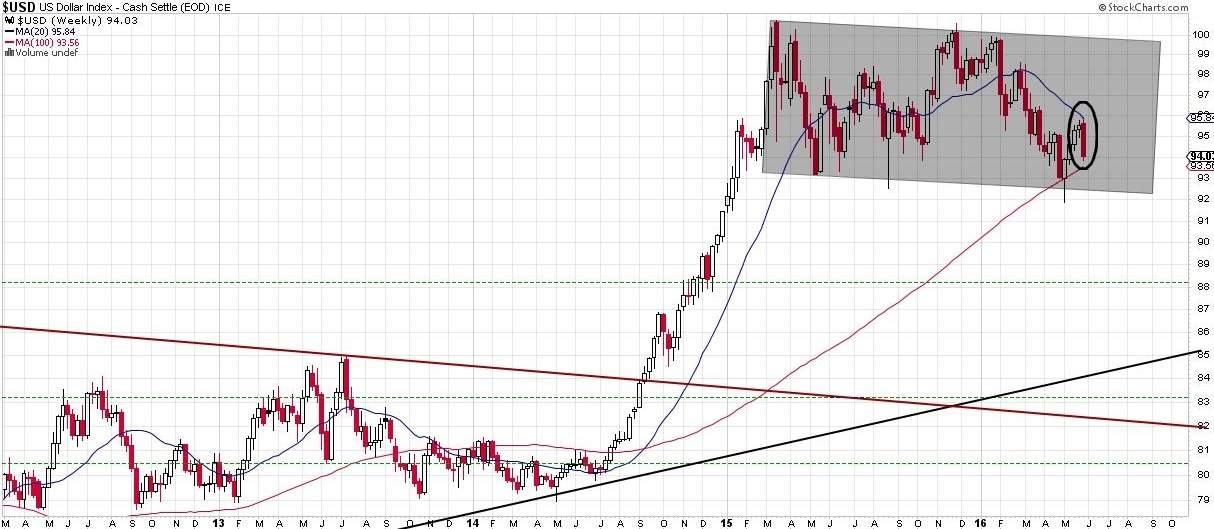
Quite a Friday we had last week, huh? Upon checking my “End of Week” Charts, I noticed some interesting behaviour and thought I’d share my observations. Last weekend sometime, I shared a weekly chart of the US Dollar and that it was approaching its 20 week MA. I use the 20week and 20day moving averages as basic bull/bear filters. I’m only bullish on stocks that are above both and I’m only bearish on stocks that are below both.
I find this makes for an easy and efficient filter. I thought that the US Dollar had reversed short of the test until I saw it after the close Friday and realized it had tested the 20week MA exactly. Take a look. (click any chart for a larger size version)
In reaction, pretty much every commodity popped Friday. (futures quotes from finviz.com)

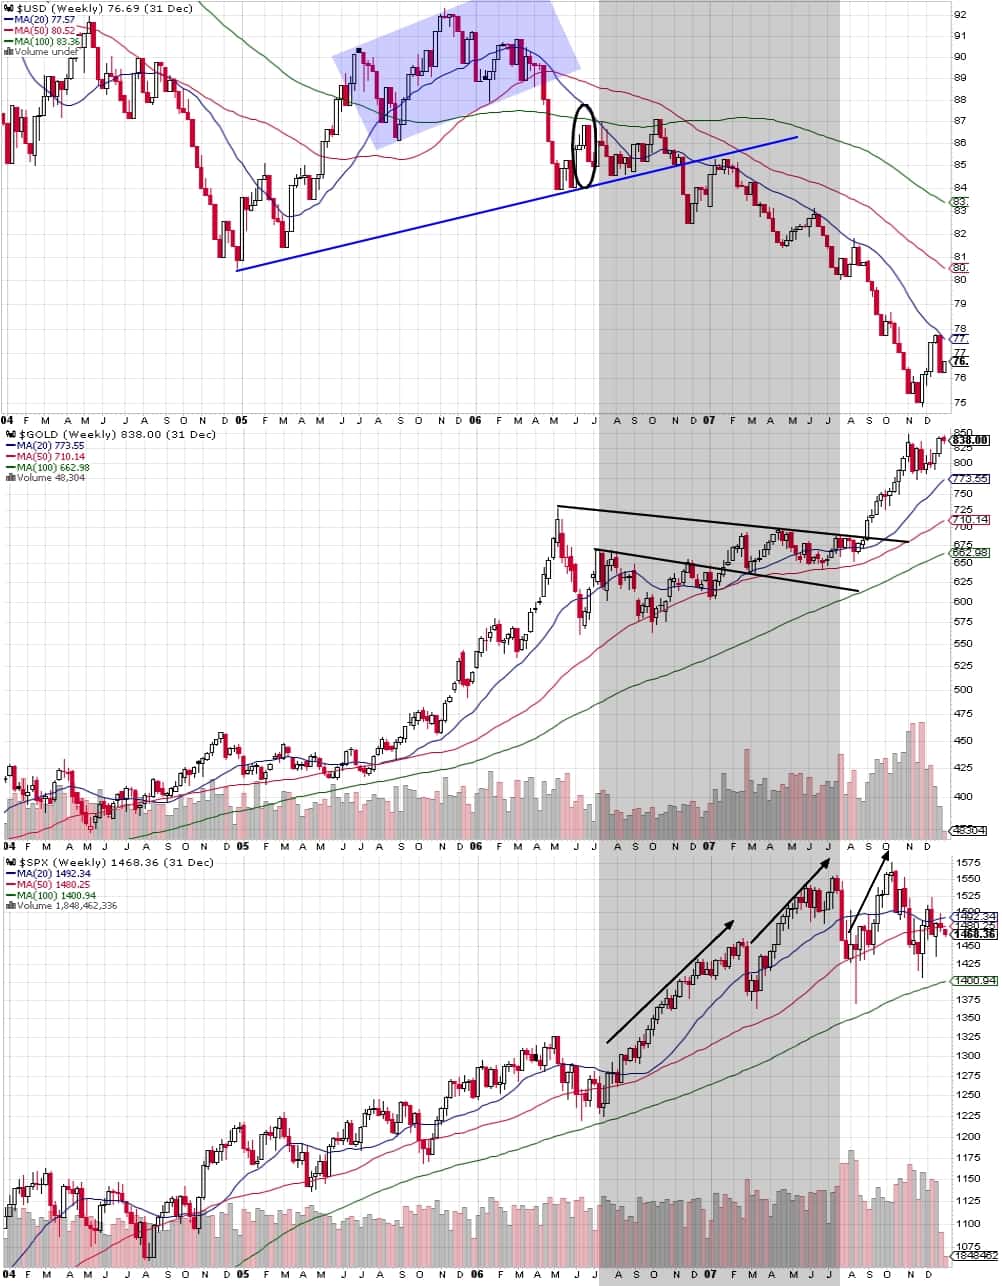
I’ve been told in the past that in the progression of a bull market, it usually ends with commodities going gangbusters, crushing margins and running away inflation-wise. I’m not enough of a market scholar to comment on such things so I will leave that to others. Now this is just speculation, of course, but I went back and looked at if there was a similar US Dollar breakdown before the 2007 bull market top. That chart is below.
I circled the US dollar 20 week test and sharp rejection that is spookily similar to this week’s price action. Of course, price discovery will look different this time around, but judging from the last time, gold more less chopped around than just taking off (so that’s a warning to the gold bulls out there), and it took a more serious trendline break to make a new recent high on gold at the time. Meanwhile, when the US Dollar started showing weakness, the stock market really ramped up after a fairly choppy and shallow uptrend and that’s a warning to anyone who thinks the market can’t go much higher from here. After all, the market can do anything.


