
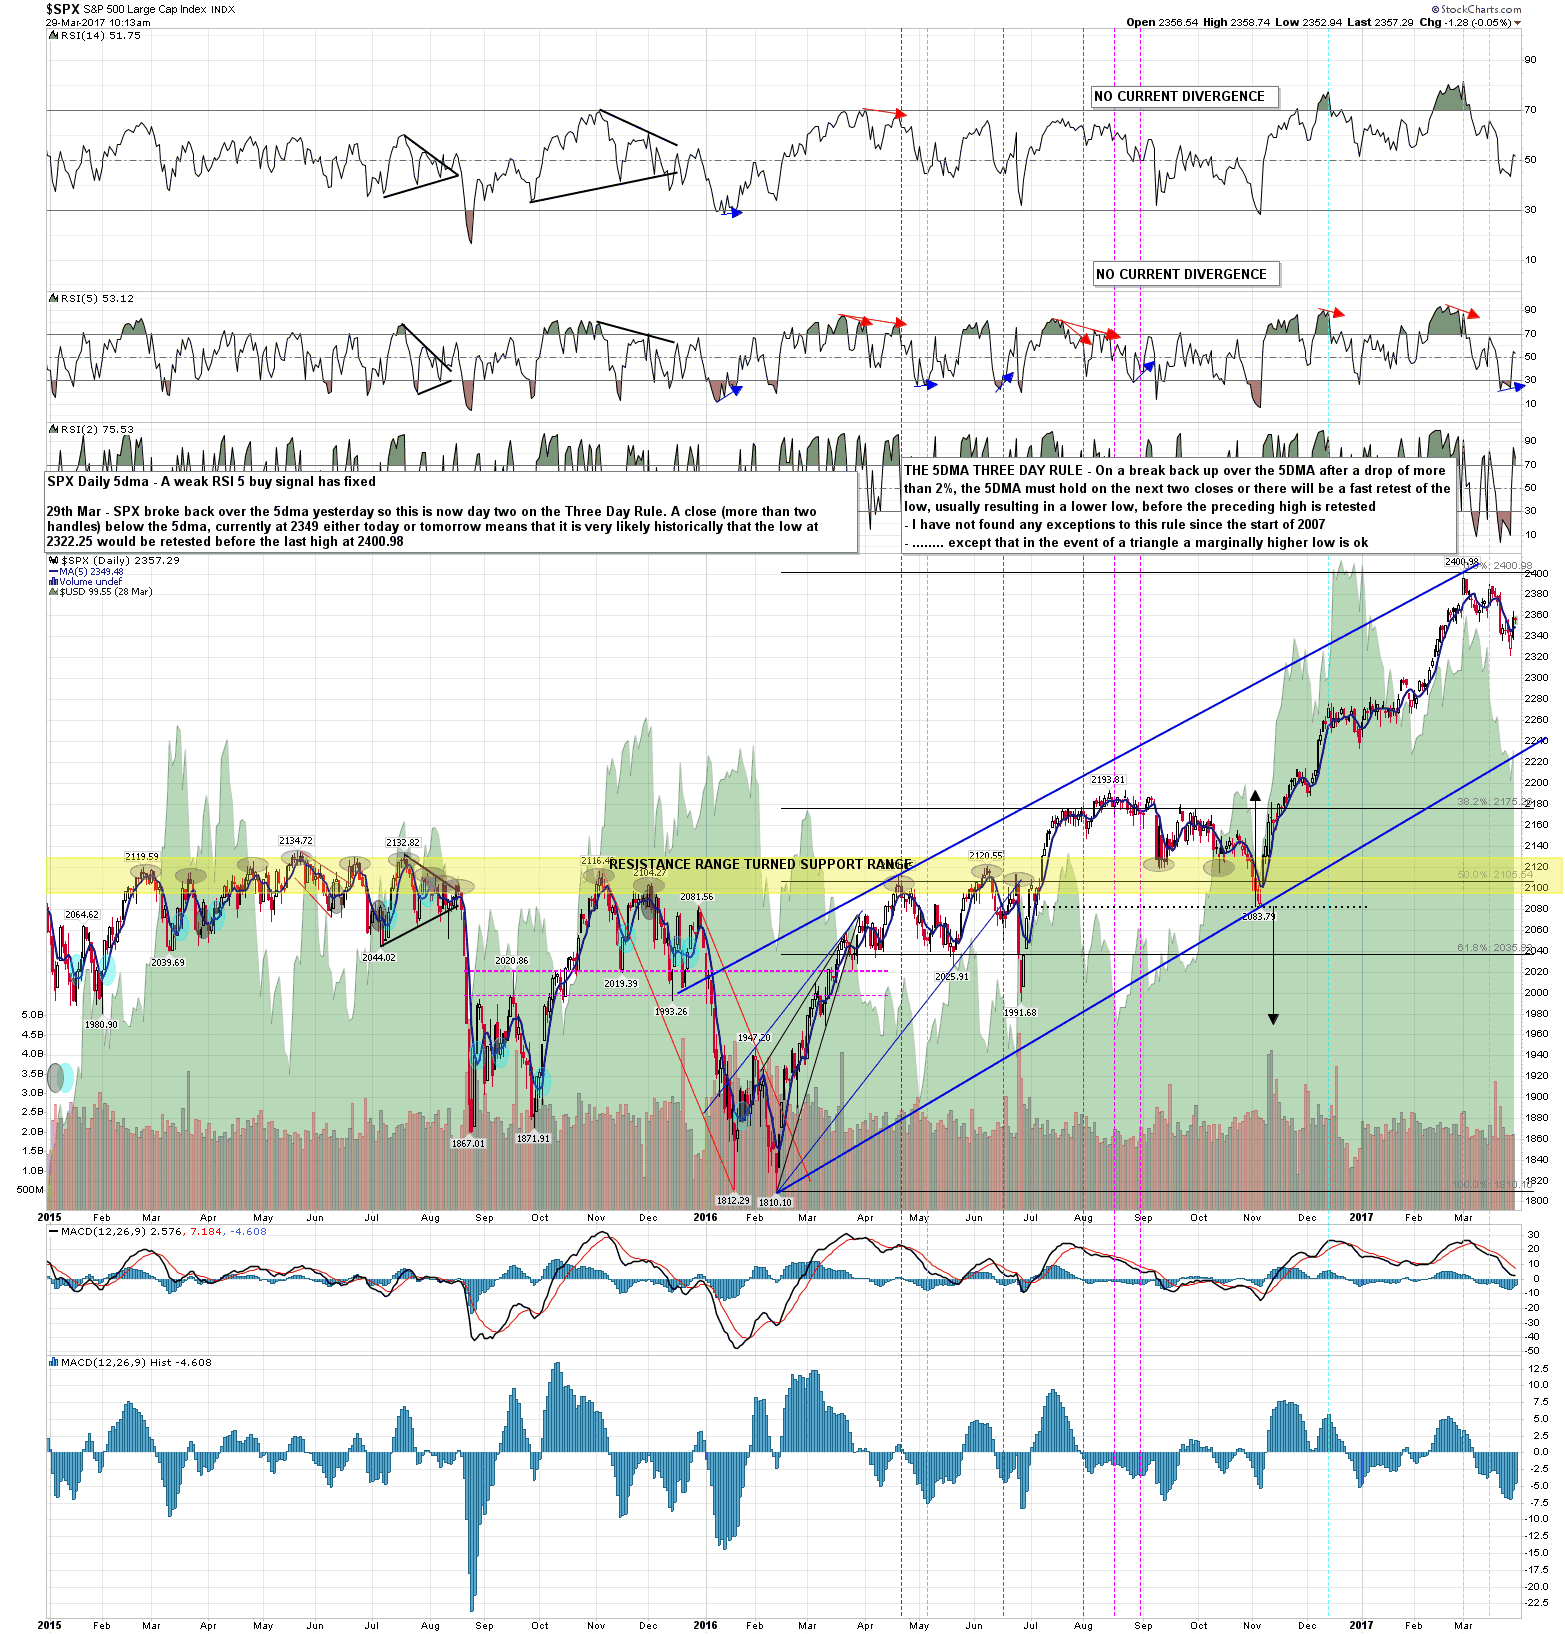
Bulls had a good day yesterday and delivered a conviction break back over the 5dma. As the decline was more than 2%, that puts SPX back on the 5dma Three Day Rule. The 5dma is currently in the 5350 area and on a daily close back below today or tomorrow, requiring a clear break of more than 2.00 handles below the 5dma at the close, then historically the odds are very high that the low 2322.25 at will be fully retested before a retest of the last significant high, which here is the ATH at 2400.98. This is a very impressive performer as a statistic, of about 60 examples since the start of 2007 there were only two that failed to make a lower low, and those were both very near misses while triangles were forming.
That said there’s nothing much to suggest a bull fail here yet, and while I’ll be watching the 5dma carefully today and tomorrow, against those instances that closed back below the 5dma within the Three Day Rule, a considerably larger number continued upwards after the break back up. SPX daily 5dma chart:
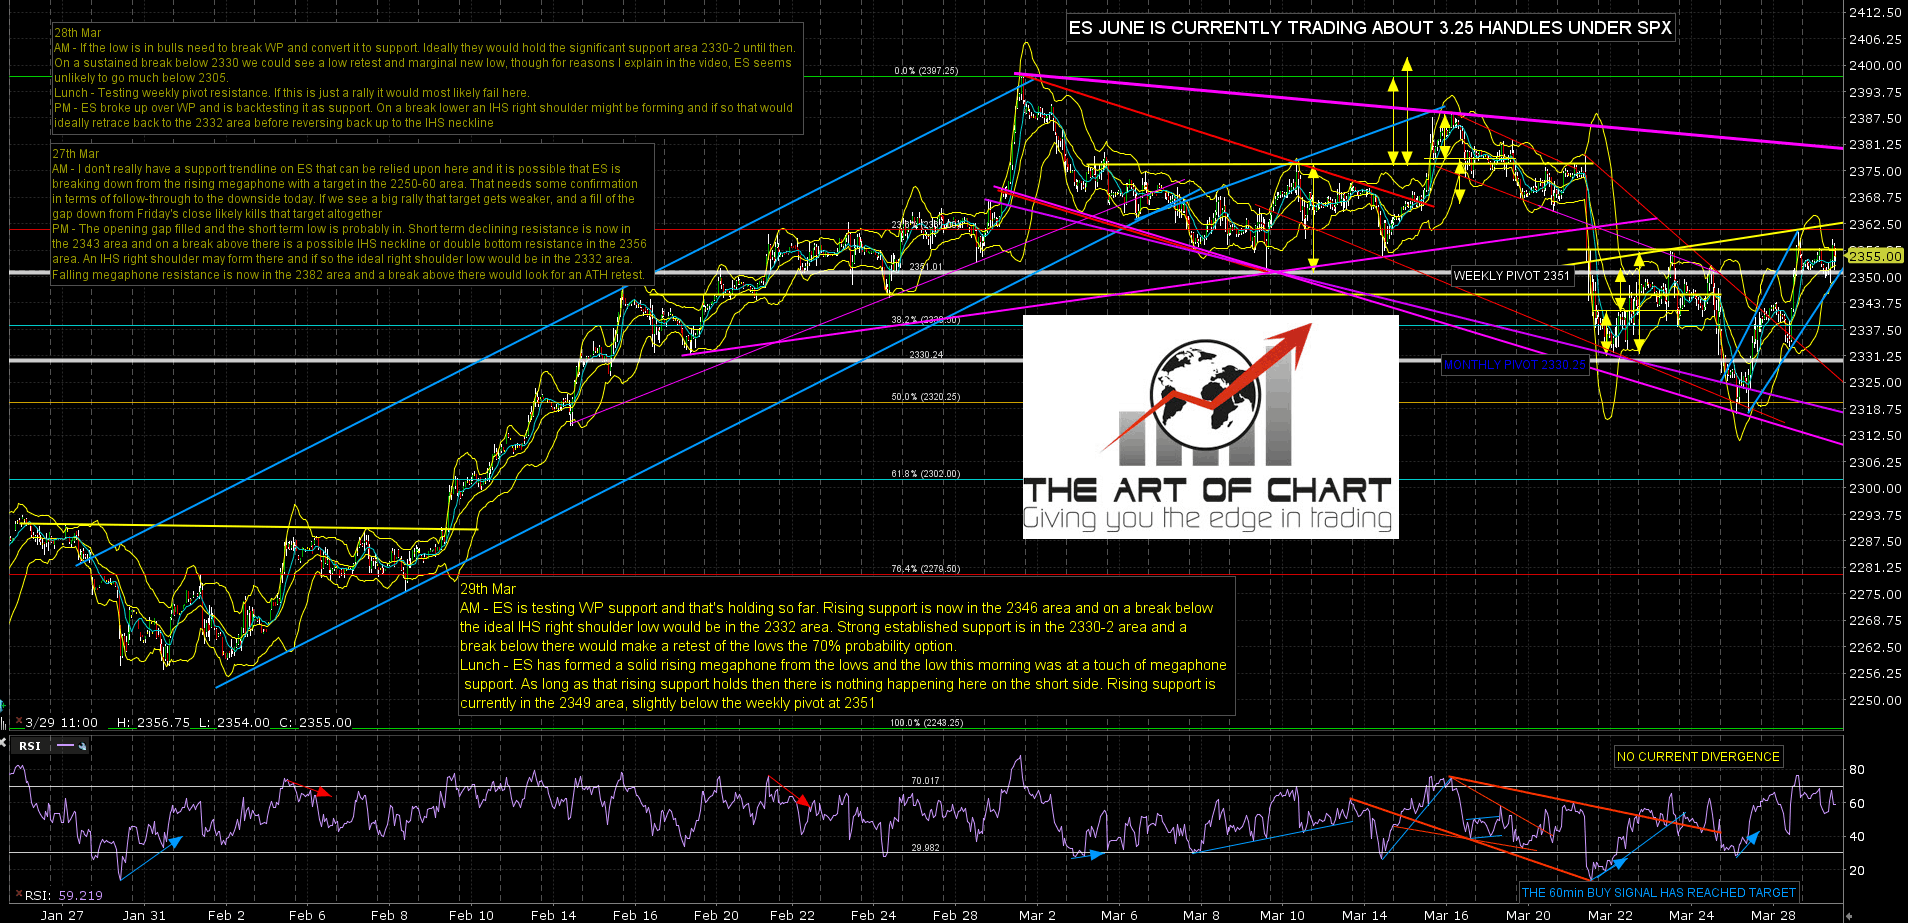
On ES a rising megaphone has formed from the low and the low this morning was a third touch on the now strong support trendline. That’s currently in the 2349 area, slightly under the weekly pivot at 2351. As long as these two important support levels remain support there is nothing of much interest happening on the short side here. ES Jun 60min chart:
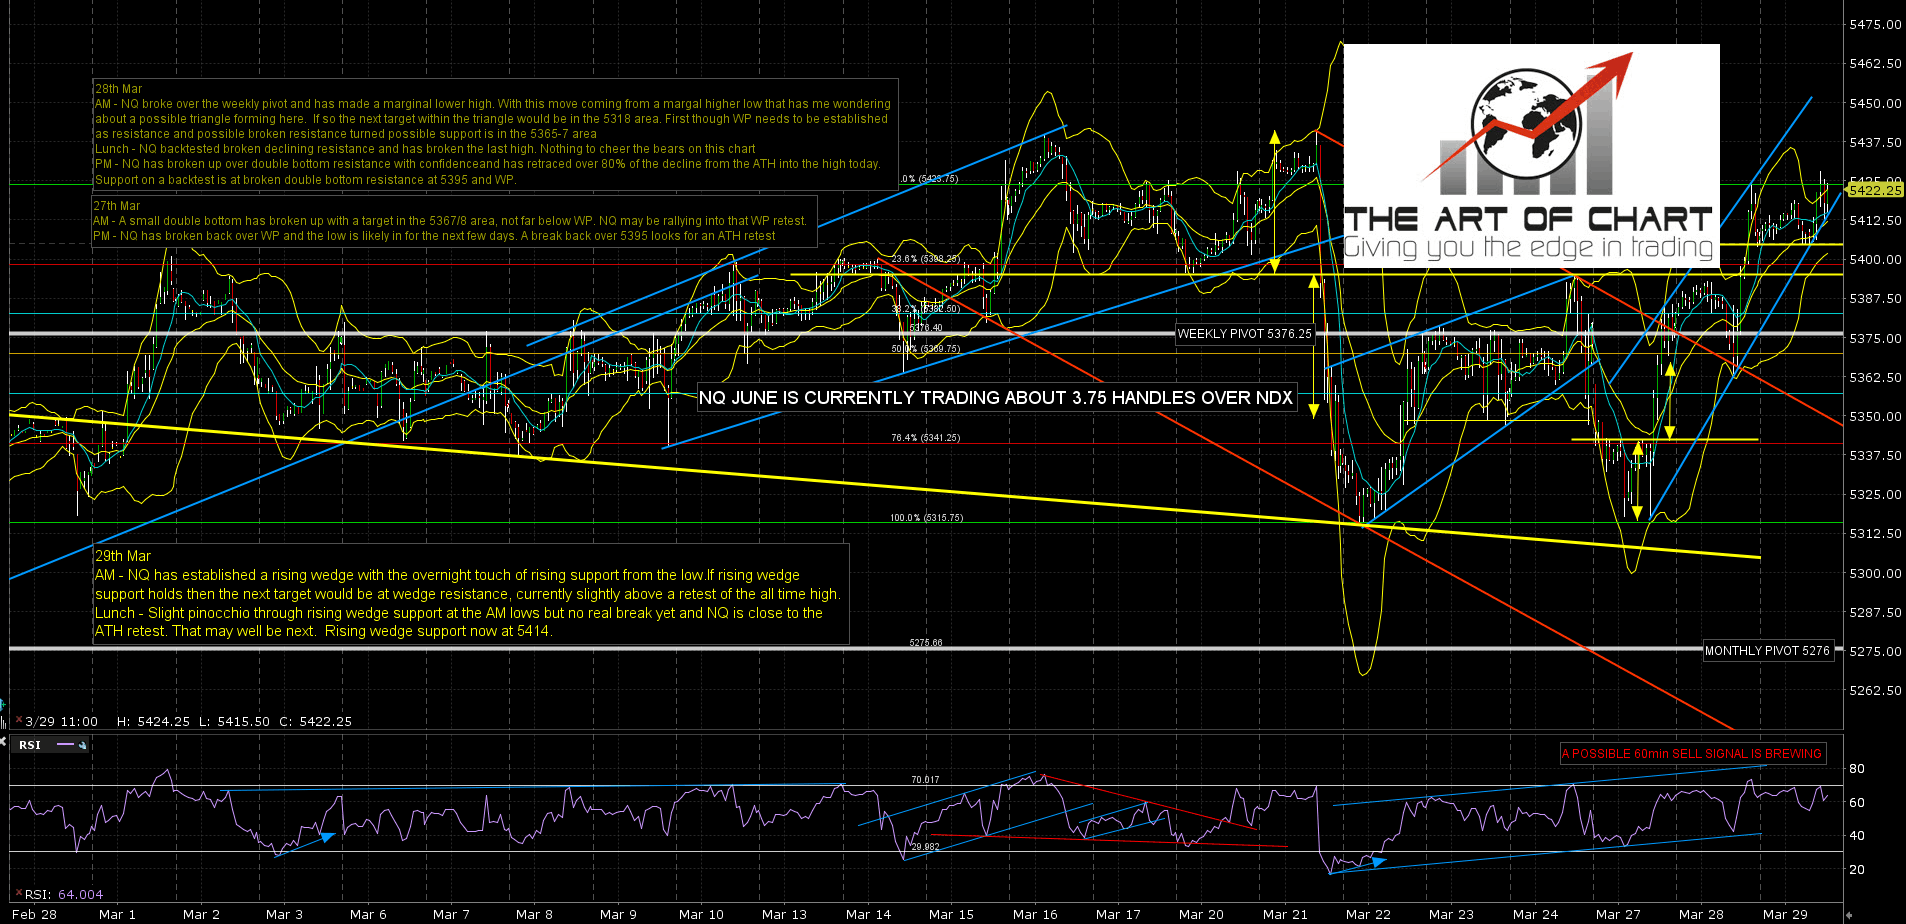
There is a clear rising wedge on NQ here and rising support has been slightly pinocchioed at the lows this morning. No clear break however and as long as that rising support doesn’t break with more conviction the support trendline is still good. A possible 60min sell signal is brewing, so if we see a sharp reversal on NQ here, then that could really follow through. NQ Jun 60min chart:
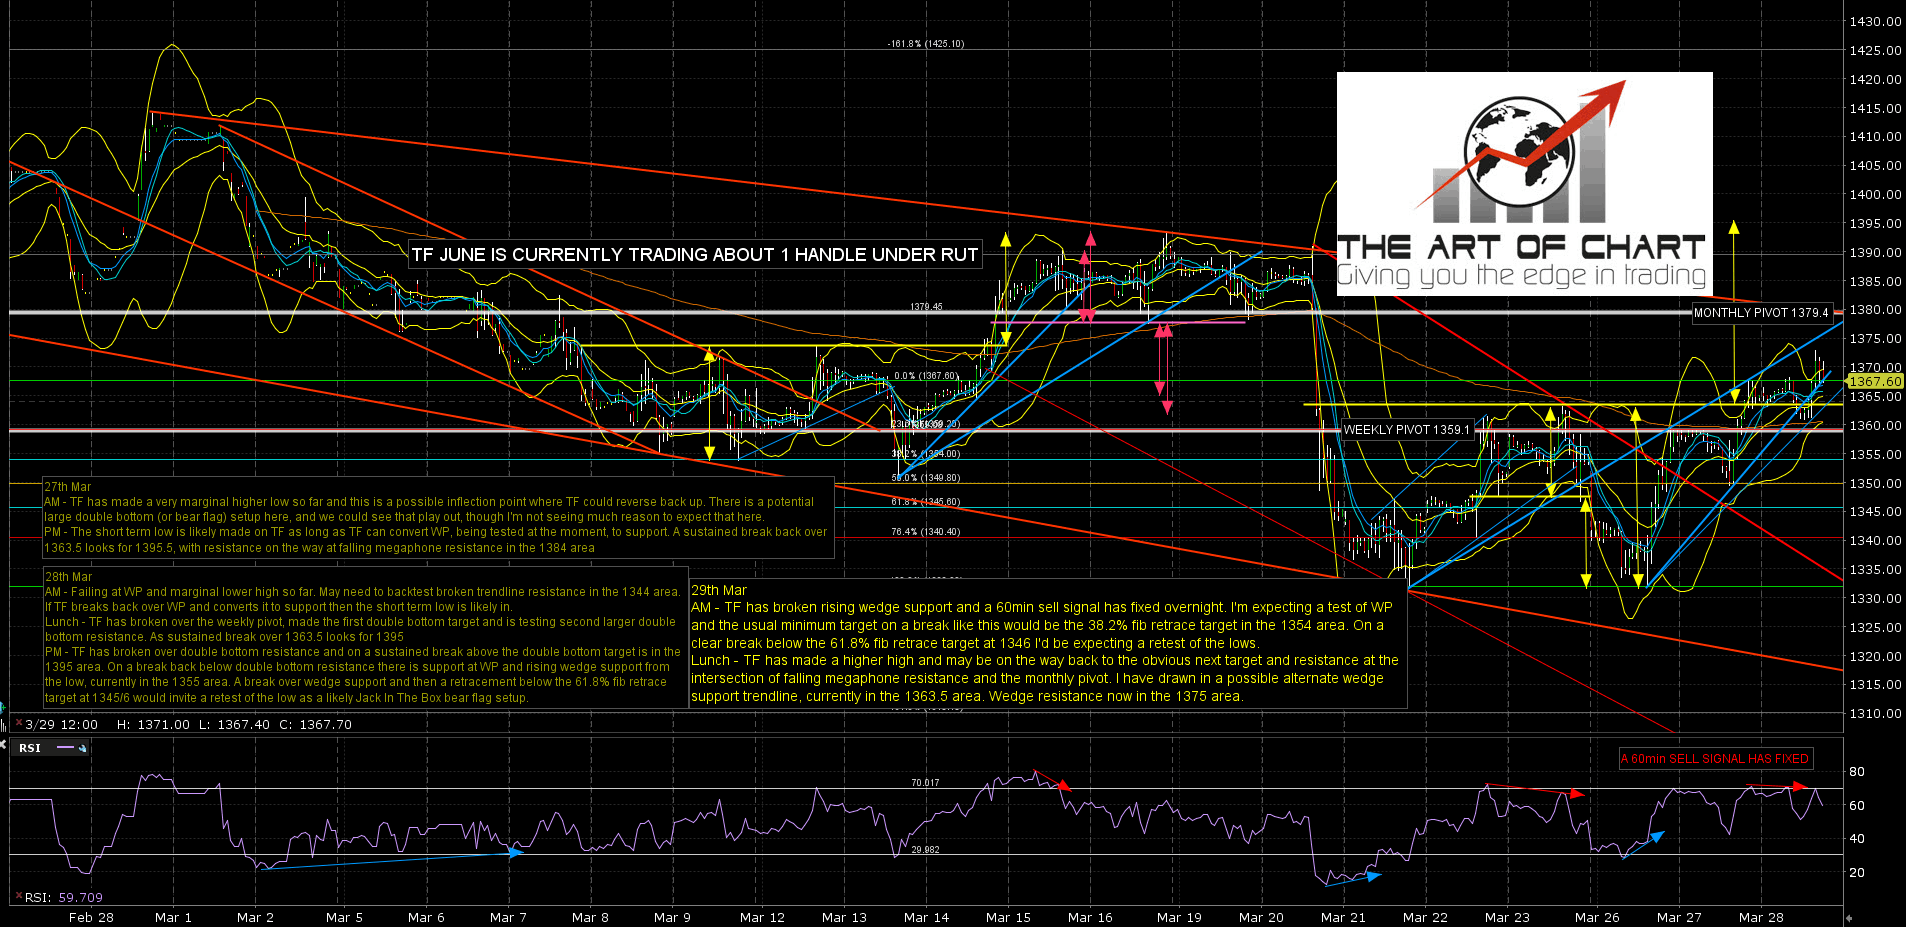
A rising wedge formed on TF into yesterday’s high and broke down overnight, fixing a 60min sell signal at the time. That looked potentially very bearish this morning but less so now at higher highs. There is a very obvious target area above at the intersection of falling megaphone resistance and the monthly pivot at 1379, and if we are to see a hard reversal on TF, that would be the obvious level to see it. TF Jun 60min chart:
There is a possible downside scenario here which I’ve been outlining, but while the bulls might drop the ball here, at the moment they still have the ball and there’s no obvious sign that they are about to drop it. Watching the support trendlines on ES, NQ & TF for breaks which may well not happen. The 70/30 lean to the bull side that I gave on Monday in the event that the opening gap down from Friday was filled is still at 70/30 or maybe a bit higher. On SPX the next resistance is the daily middle band, currently at 2365, and bulls need to break above that on a daily closing basis.
We like to do a free public Chart Chat webinar at theartofchart.net on the first weekend of every month and we are doing the next one on Sunday 2nd April at 4pm EDT. If you’d like to attend you can sign up for that on the April free webinars page at theartofchart.net and you can see that here.
