Slope of Hope Blog Posts

Slope initially began as a blog, so this is where most of the website’s content resides. Here we have tens of thousands of posts dating back over a decade. These are listed in reverse chronological order. Click on any category icon below to see posts tagged with that particular subject, or click on a word in the category cloud on the right side of the screen for more specific choices.

Divergences Warn Of Impending Correction

By -

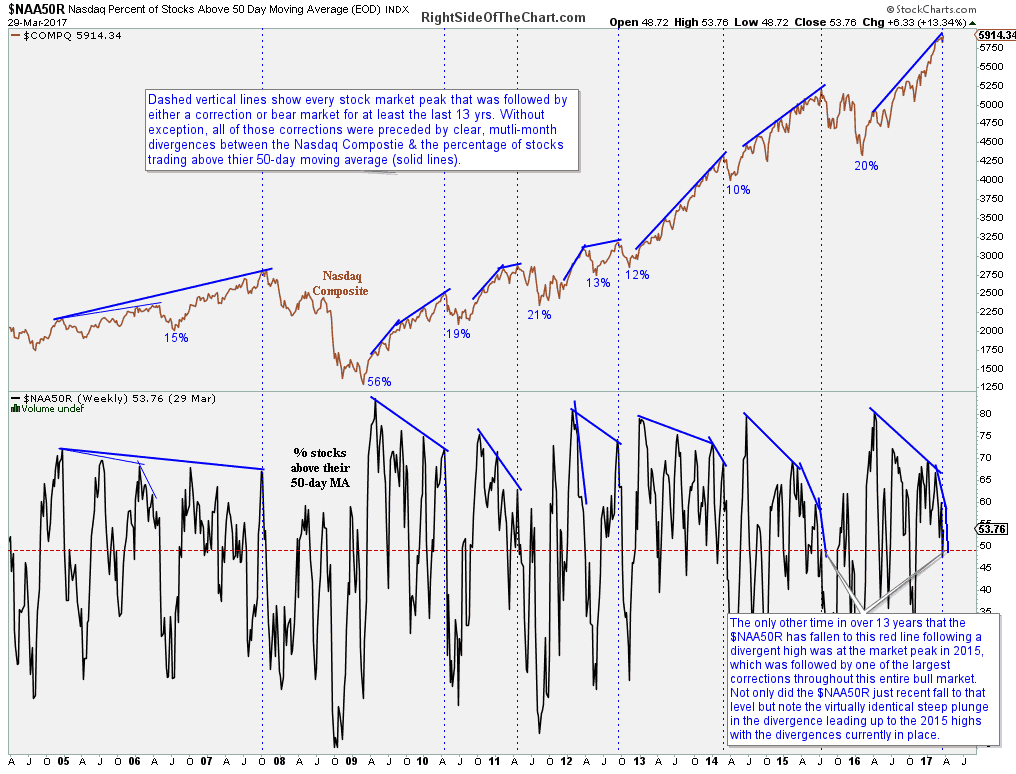
The chart below shows the Nasdaq Composite plotted above the percent of stocks within the Nasdaq Comp trading above their 50-day moving average. The dashed vertical lines show every stock market peak for at least the last 13-years.

Without a single exception, all of those corrections (a drop of 10% or more) and bear markets (20%+ drops) were preceded by clear, multi-month divergences between the Nasdaq Comp & the percentage of stocks trading above their 50-day moving average. Of particular note is the recent plunge in the $NAA50R which virtually mirrors the plunge that preceded the market top in 2015 which was followed by one of the largest corrections throughout current 8+ year bull market.

$NAA50R daily March 30th

(more…)

The 5dma Three Day Rule – Day Three

By -

Today is Day Three on the 5dma Three Day Rule and SPX is testing important resistance on a lot of negative divergence, with an RSI 5 sell signal brewing on the hourly chart. There are also 60min RSI 14 sell signals fixed on ES and TF, with another brewing on NQ. This test of the daily middle band may well be the last really decent chance for bears this week, and what they need to do is reject from the daily middle band at 2364/5 and close enough below it to break the 5dma at 2354/5. This is a nice setup and that could happen. The bulls need a close above the daily middle band ideally, and a close on or above the 5dma at minimum. SPX daily 5dma chart:

170330 SPX Daily 5dma

(more…)