The alternative rock band Green Day once sang “Wake me up when September ends.” Now that September trading is over, let’s see where THE most important chart in the world stands.
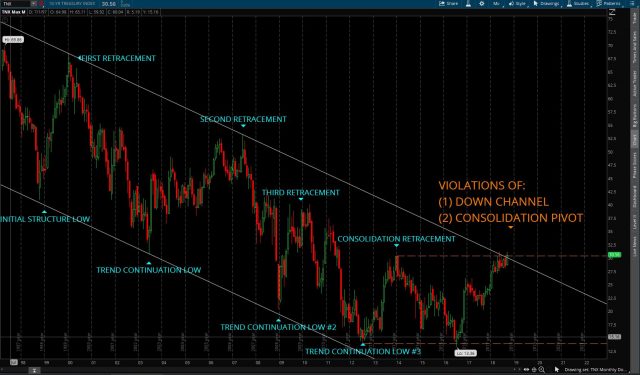
Like Luke Skywalker sending a proton torpedo into a two-meter wide ray shielded thermal exhaust port opening, bond bears finally mustered enough strength to push the monthly chart of the U.S. 10-year treasury index up and out of its nearly two-decade long down channel.

This Herculean effort also broke and closed a monthly candle above the prior swing retracement pivot of 30.36 (3.036% interest rate) from December of 2013. A double win for those bearish on interest rate related products, such as our fearless bear leader.
But before others jump on the bear bond train, let’s point out in a CLEAR, OBJECTIVE way that what price action has done on this timeframe is NOT switch its trend… but change from trend to consolidation mode.
Price still must break and close a monthly candle above the high of the third retracement in this down move (40.14 or 4.014% from June of 2009) before we can objectively (via price action) say the overall “trend” has ended.
Bond bulls may smirk at bears right here and point out September’s candle did not touch, let alone close above May’s high of 31.15 (3.115%). So this could all be just a fake out to get breakout bears in so bulls could get better prices for entry.
Should that happen, the infamous words of Admiral Ackbar will come screaming into many a breakout bears’ minds:
![]()
Central bankers’ official statements give us a plausible reason to believe that this interest rate rise will likely continue. But until the market shows us that’s happening, we can only point out the price action in context of where it stands on the chart.


