Since it appears the loftiest thing the citizens of the United States can seem to discuss is either
(a) which Mario Kart  character the POTUS’ wanger most closely resembles; or
(b) whether or not two felt puppets are actually gay or not (see image to the right)
Then I guess I’d better just repeat what I did yesterday and sing The Alphabet Song. Or, more precisely, share with you what I thought were interesting charts as I thumbed through my ETF watch list from A to Z. Some will be repeats from yesterday, and some others will not.
I’d be lying if I said I wasn’t disappointed in the action on Tuesday. Although I’ve been through enough disappointment to not get excited about a big double-digit drop on both ES and NQ during nighttime trading, even I wasn’t cynical enough to think that ratcheting up the trade war would actually push markets to lifetime highs in some cases. And yet that’s precisely what happened.
So here we go again.
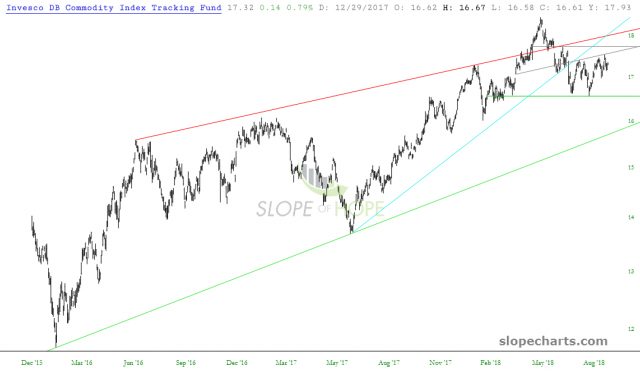
First off we have commodities, by way of DBA. In spite of oil’s crazy strength in recent months, my view is that commodities in general are more inclined to weakness than continued strength for the balance of the year.
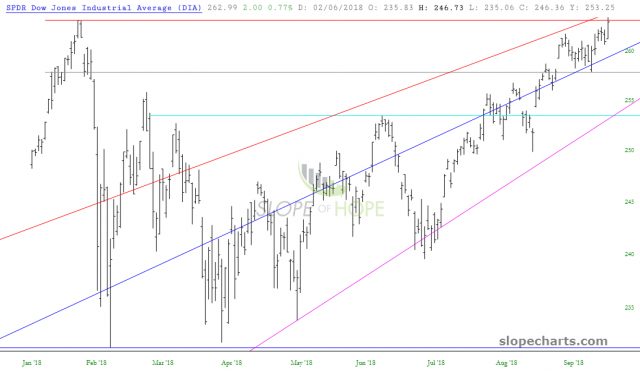
Equities in general continue to be ungodly strong, particularly in the no-longer-bothered-by-China land of industrial stocks. The “diamonds” pushed to a lifetime high on an intraday basis.
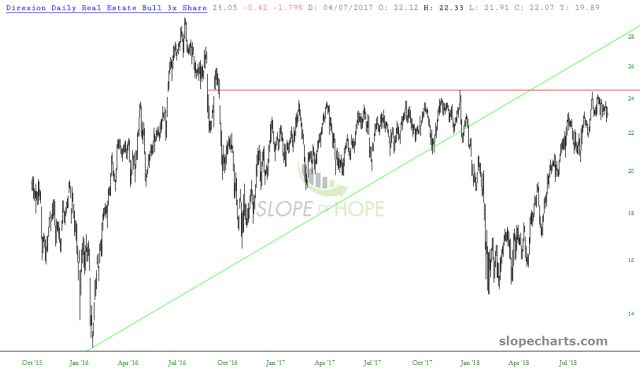
One of the few areas of weakness continues to be real estate, which is feeling gravity’s pull of higher interest rates.
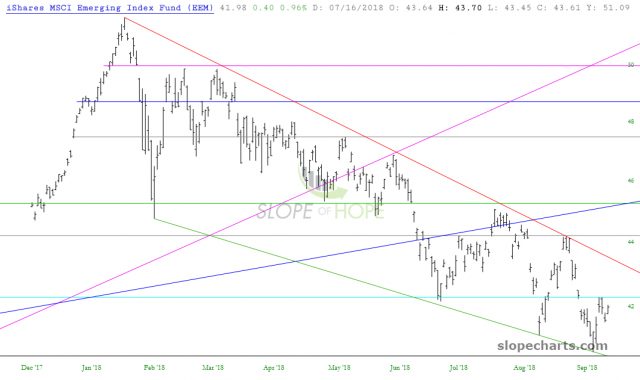
Emerging markets is at a particularly interesting juncture. A push above that blue horizontal would add fuel to the United States fire. In other words, sinking emerging markets haven’t done much to suppress the U.S., but a strong emerging markets fund would supercharge already-strong U.S. markets. I think the EEM will remain in its descending channel, but it definitely has room to rally.
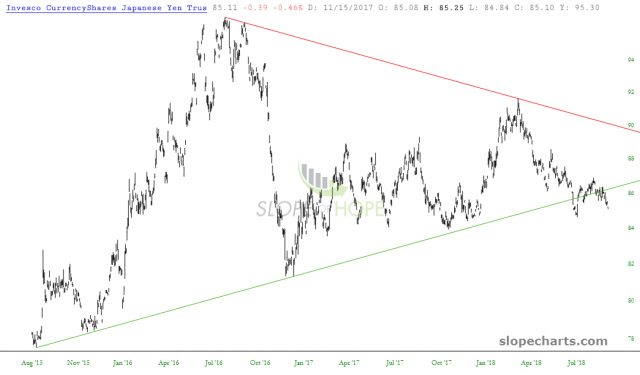
The Japanese Yen Trust is fairly thinly traded, but I point chart out mainly because the failed symmetric triangle suggests continued precious metals weakness (on the heels of 7 years of the same).
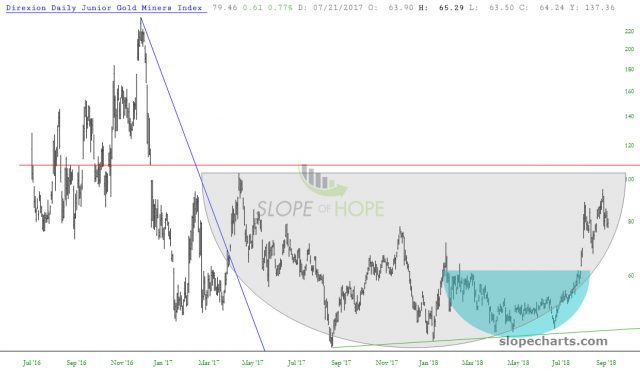
In fact, if metals remain as lame-o as I am suspecting, a good long-term buy might be JDST, which sounds insane since it is triple inverse leveraged. All I can say is that this is a remarkably well-formed saucer pattern and, thus, bullish.
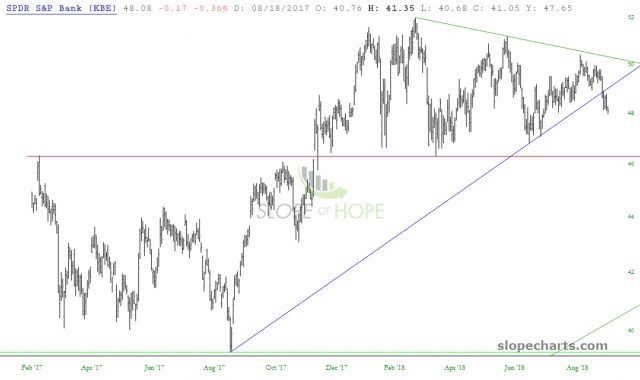
Another exception to the everything-is-awesome market is the bank index, shown below via KBE. This uptrend is plainly broken.
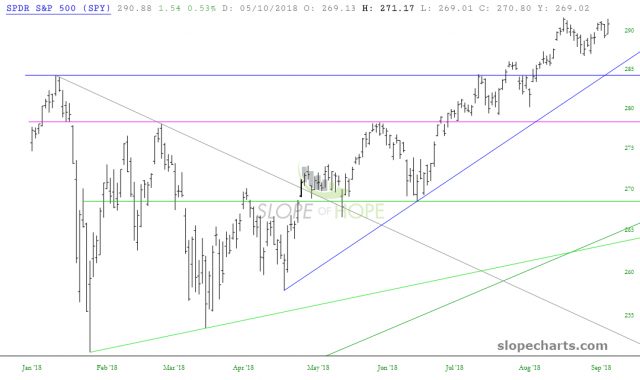
But, as with the Dow Industrials, the broader market (in this case the SPY, which is far more diverse than the DIA) is simply on fire. There is nothing bearish about this chart.
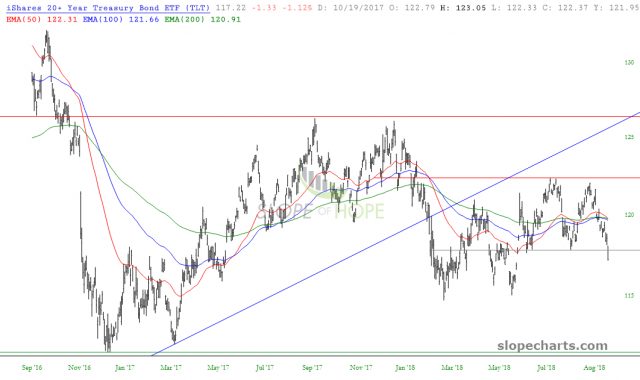
The only bright spot for me today was interest rates, which continue to climb as bonds continue to sink, as shown below.
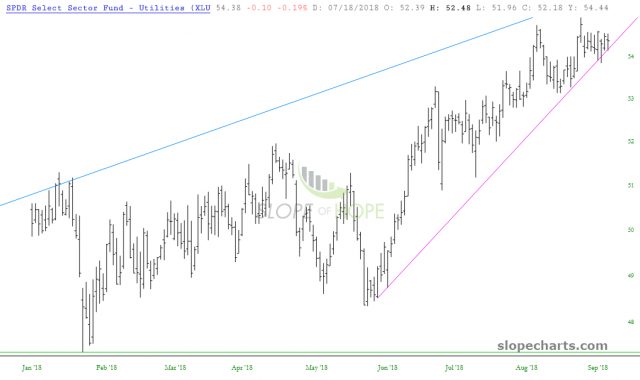
What is vexing to me, however, is that Utilities aren’t really playing along. Sure, they are down, but they seem to be unnaturally resistant to weakness. Here we see XLU dropped only 0.19%, compared to a drop by the TLT of almost a hundred basis points more than that. Frustrating!
I remain “aggressively, but not very aggressively” short across 50 positions, only 2 of which are ETFs (XLE and XLP).


